How hot is a 700 km ultra? Five editions of the Madrid-Barcelona
weather-race-comparison
The temperature recorded by my bike computer in five editions of the Madrid-Barcelona by Pedalma: which one was the hottest, where on the route the heat and the cold hit, and why it depends on the start time.
The Madrid-Barcelona by Pedalma is an unsupported ultra-distance ride: about 700 km and 7,000 m of climbing on secondary roads, non-stop, with up to 50 hours to finish and in a non-competitive format. It takes more than a day, so every edition includes a full night and the hottest hours of at least one afternoon.
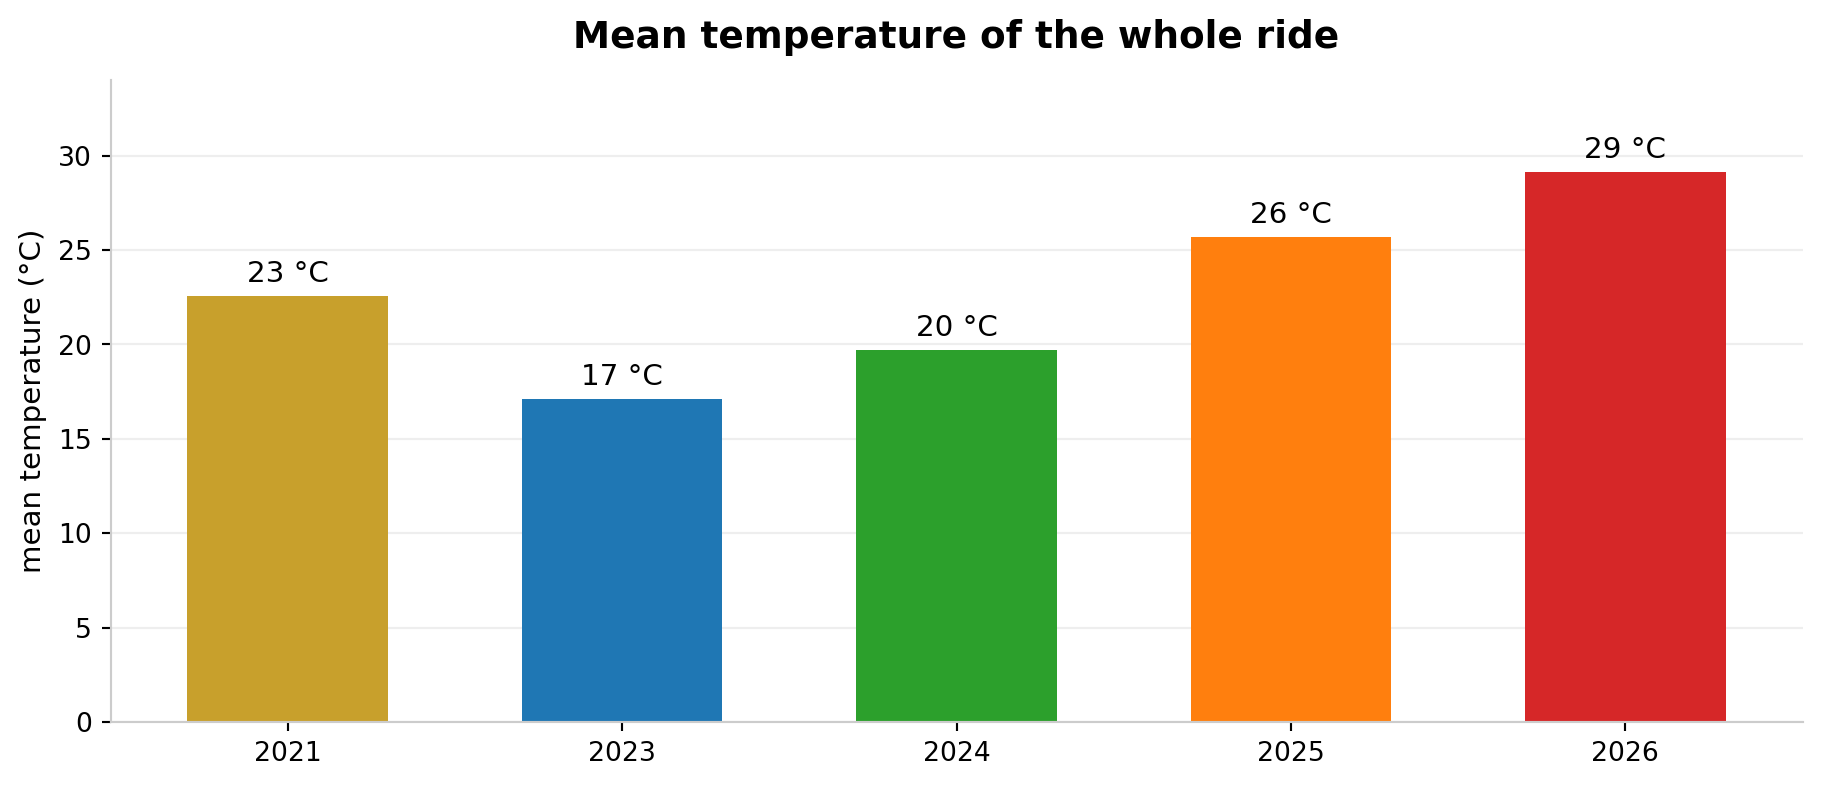
I have ridden it five times, in 2021, 2023, 2024, 2025 and 2026 (I have no file for 2022). In this post I use the temperature recorded by my bike computer to answer two questions: which edition was the hottest, and where on the route is the heat concentrated?
The short answer: 2026 was the hottest of the five editions, with the highest mean temperature and the most hours of intense heat. And the part of the route where the heat is concentrated depends on the start time.
The data
My bike computer, a Garmin Edge 1030, logs temperature, position and altitude once per second. That makes about 100,000 readings per edition, all from the same device, so the five editions can be compared with each other.
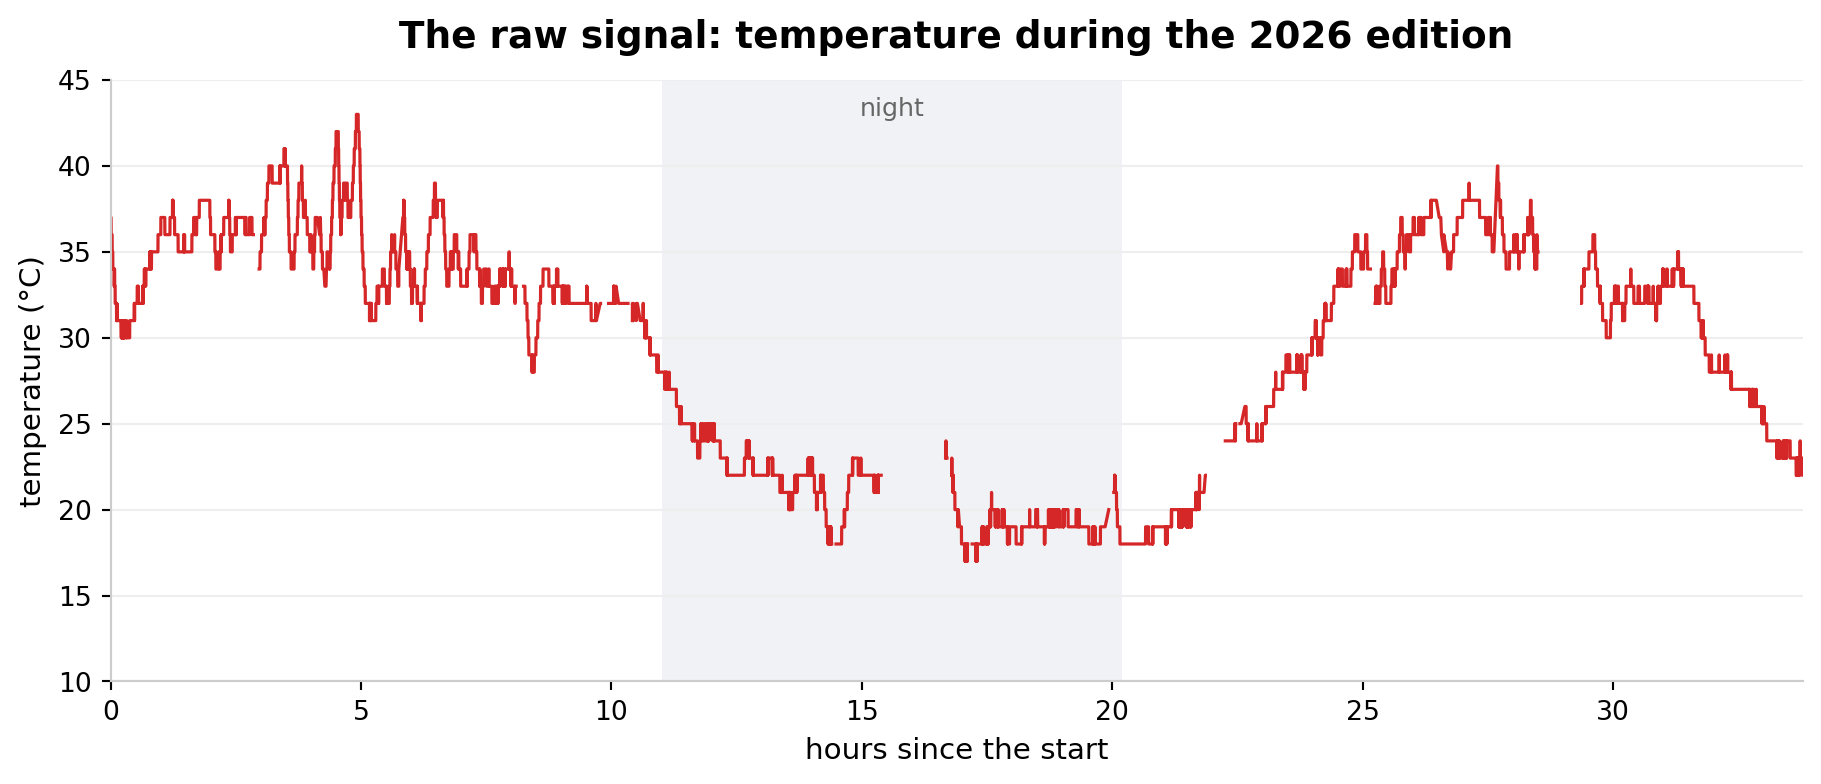
This is the raw signal of one edition. The temperature rises by day and falls at night, and the ride goes through a whole night. The breaks in the line are stops with no readings. To compare the editions, I weight each reading by the time it stands for and I line the editions up by hour of the day or by distance along the route.
Mean temperature by edition
The table gives three figures per edition: the mean temperature of the whole ride (day and night), the highest reading and the number of hours at 30 °C or above. 2026 has the highest mean and, above all, the longest time in intense heat: about 16 hours at 30 °C or above. 2025 and 2021 follow, and 2024 and 2023 were the coolest editions. The highest reading was similar in several years (43 to 46 °C), but it corresponds to isolated moments and says little about the sustained heat of the day.
| Edition | Mean temperature | Highest reading | Hours at 30 °C or above |
|---|---|---|---|
| 2026 | 29 °C | 43 °C | about 16 |
| 2025 | 26 °C | 46 °C | about 10 |
| 2021 | 23 °C | 45 °C | about 8 |
| 2024 | 20 °C | 37 °C | about 2 |
| 2023 | 17 °C | 37 °C | about 2 |
Hours in each temperature range
This chart splits the hours of each edition by the temperature at each moment, from blue (cool) to red (intense heat). What matters is the size of the warm zone: in 2026 about 16 hours were at 30 °C or above, the most of the five editions, and in 2025 about 10. In 2023 and 2024 the cool bands dominate, with very few hours at 30 °C or above.
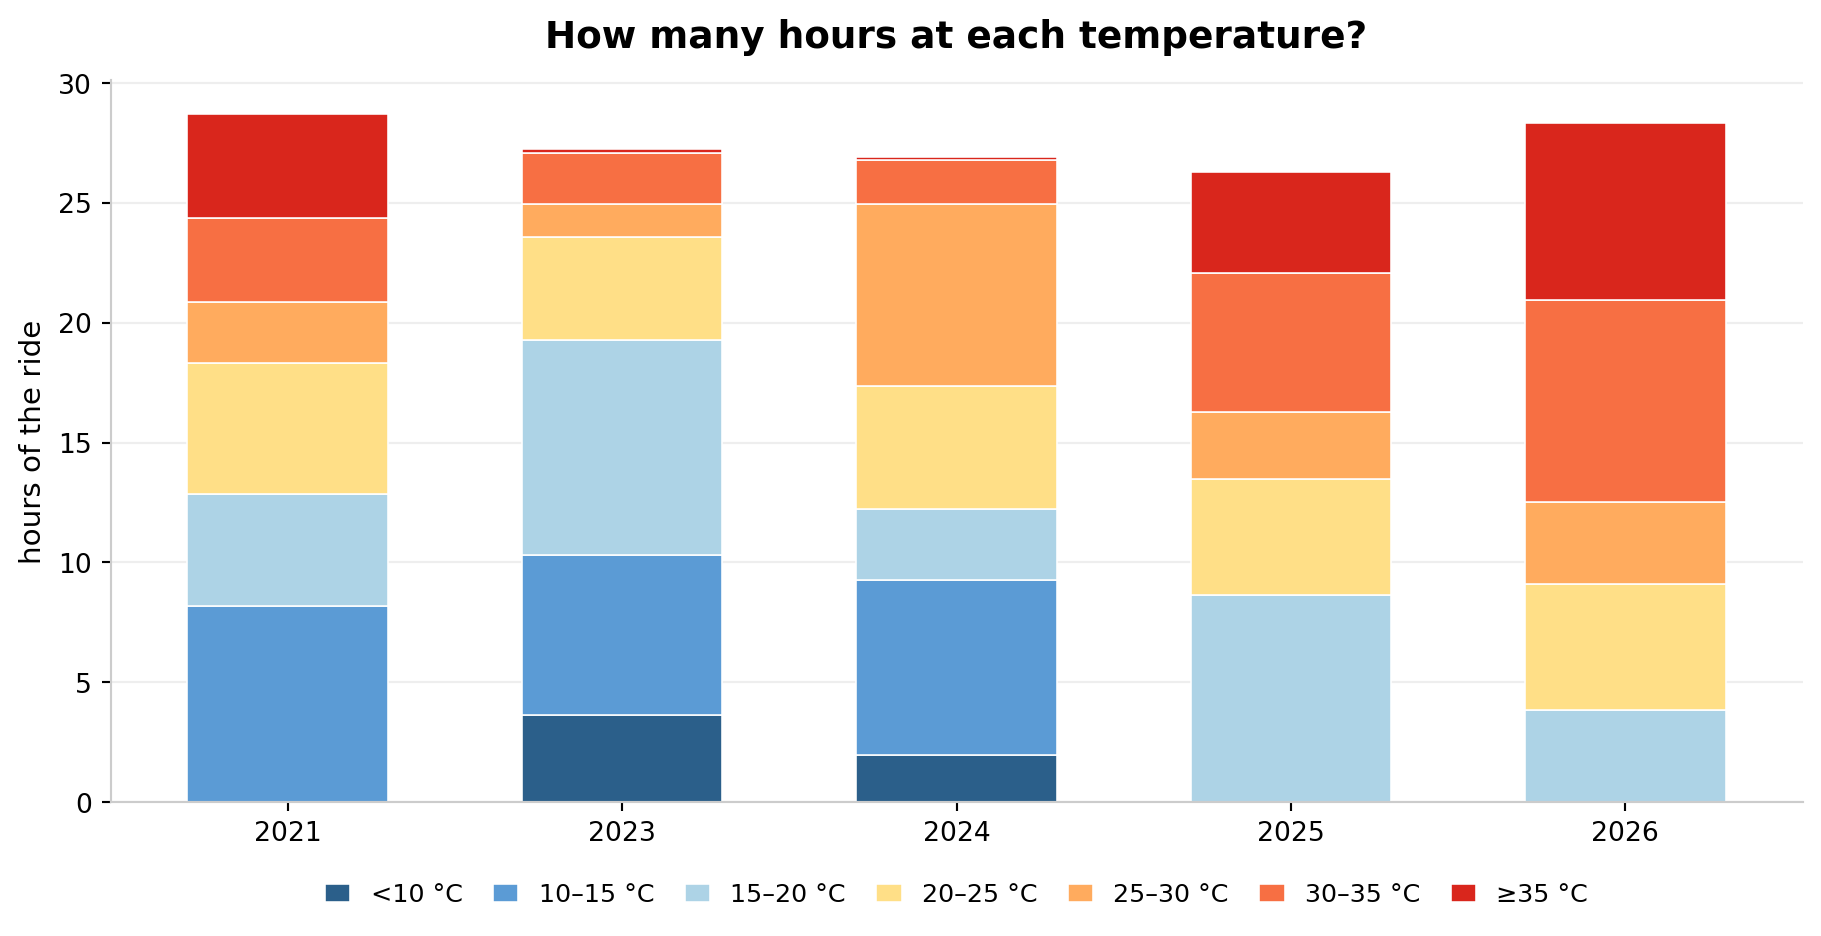
The bars add up to 26 to 29 hours, less than the full duration of the ride, because gaps in the recording, such as long stops, are left out.
One curve per edition
A whole ride can be summarised by the probability distribution of its temperature: a single curve that shows how the temperature was spread over the whole edition.
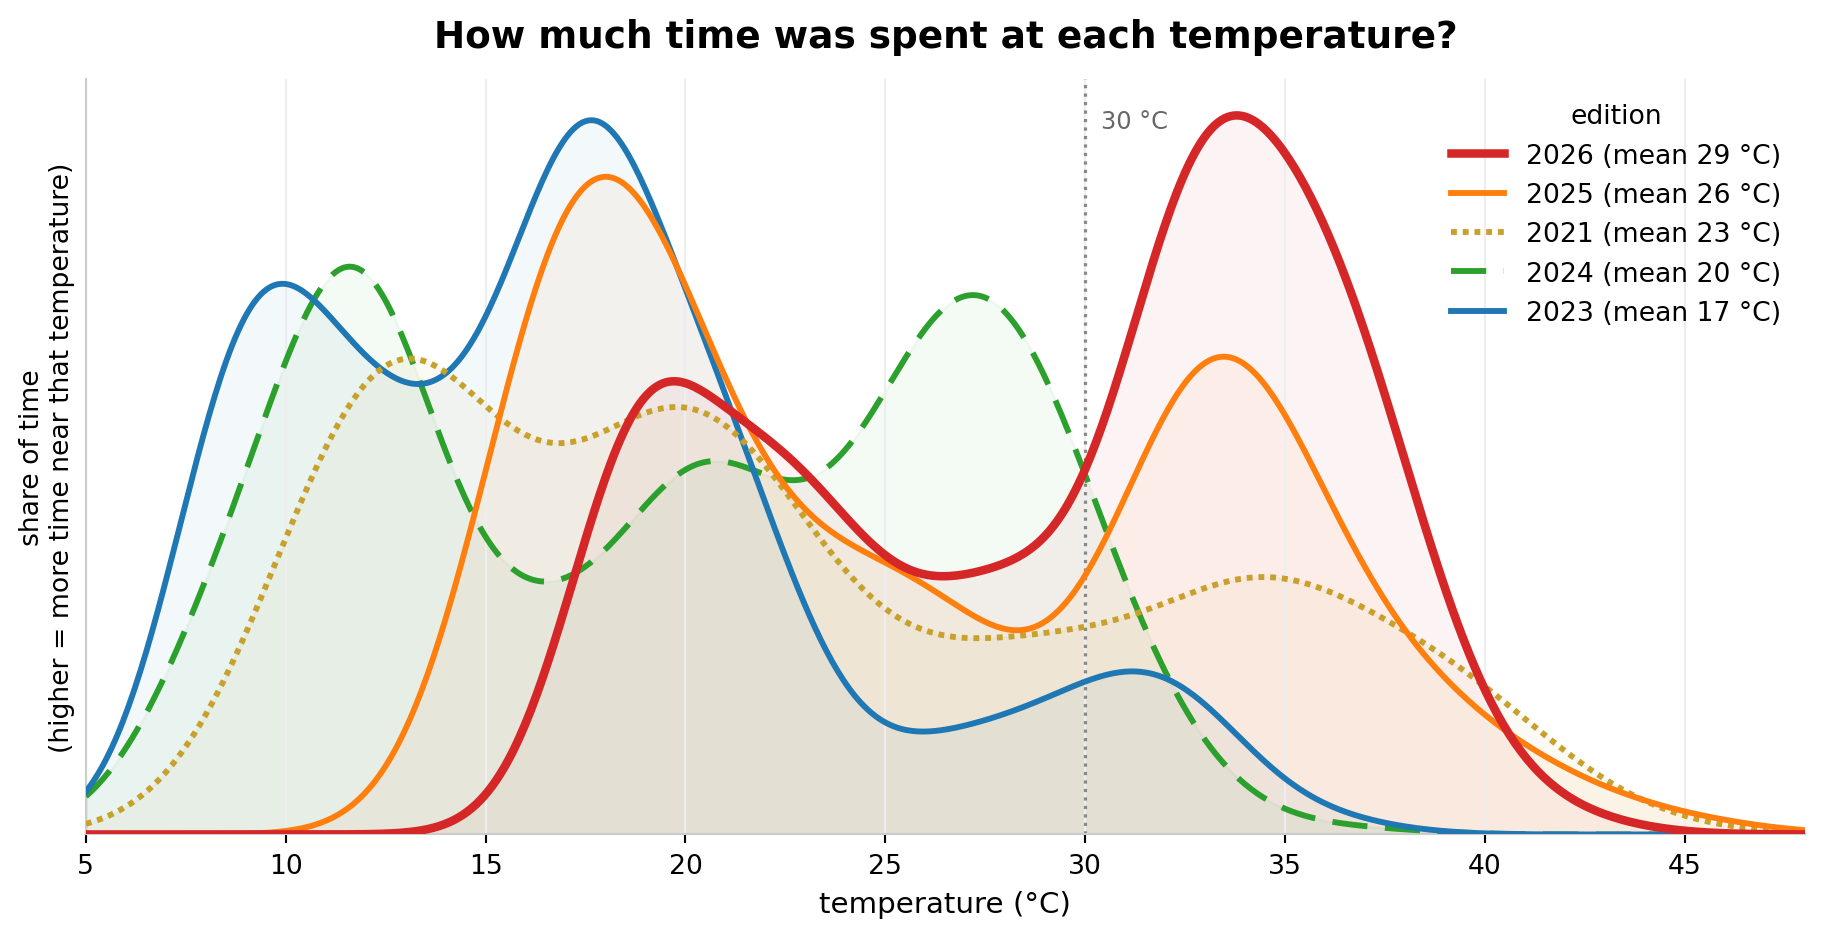
How to read it: imagine sorting all the time of the ride into piles according to the temperature at each moment. The curve draws the outline of those piles. Where the curve is high, a lot of time was spent at that temperature. Where it almost touches the floor, that temperature hardly occurred. Read two things: the shape of the curve and, above all, which side it is shifted to. The numbers on the vertical axis can be ignored. All the curves enclose the same amount of time (100% of each ride), so they differ only in where they sit, at higher or lower temperatures.
Almost every curve has two humps, because each ride includes a cool night and a hot day: the hump on the left is the early morning and the one on the right is the middle of the day. What changes from one edition to another is where those humps fall. The 2026 curve is the furthest to the right, with its main peak above 30 °C, which means a long time in strong heat. At the other end, 2023 and 2024 sit on the left, at cool temperatures, and hardly go above 30 °C. 2025 and 2021 fall in between.
Temperature by hour of the day
Each edition lasts more than a day, so this chart averages the temperature by clock hour, with one line per edition. They all follow the same pattern, lowest before dawn and highest between midday and the afternoon, but the 2026 line sits above the others at most hours, and clearly so in the evening and at night, when it hardly cools down. Only 2021 climbs higher, for a few hours in the afternoon.
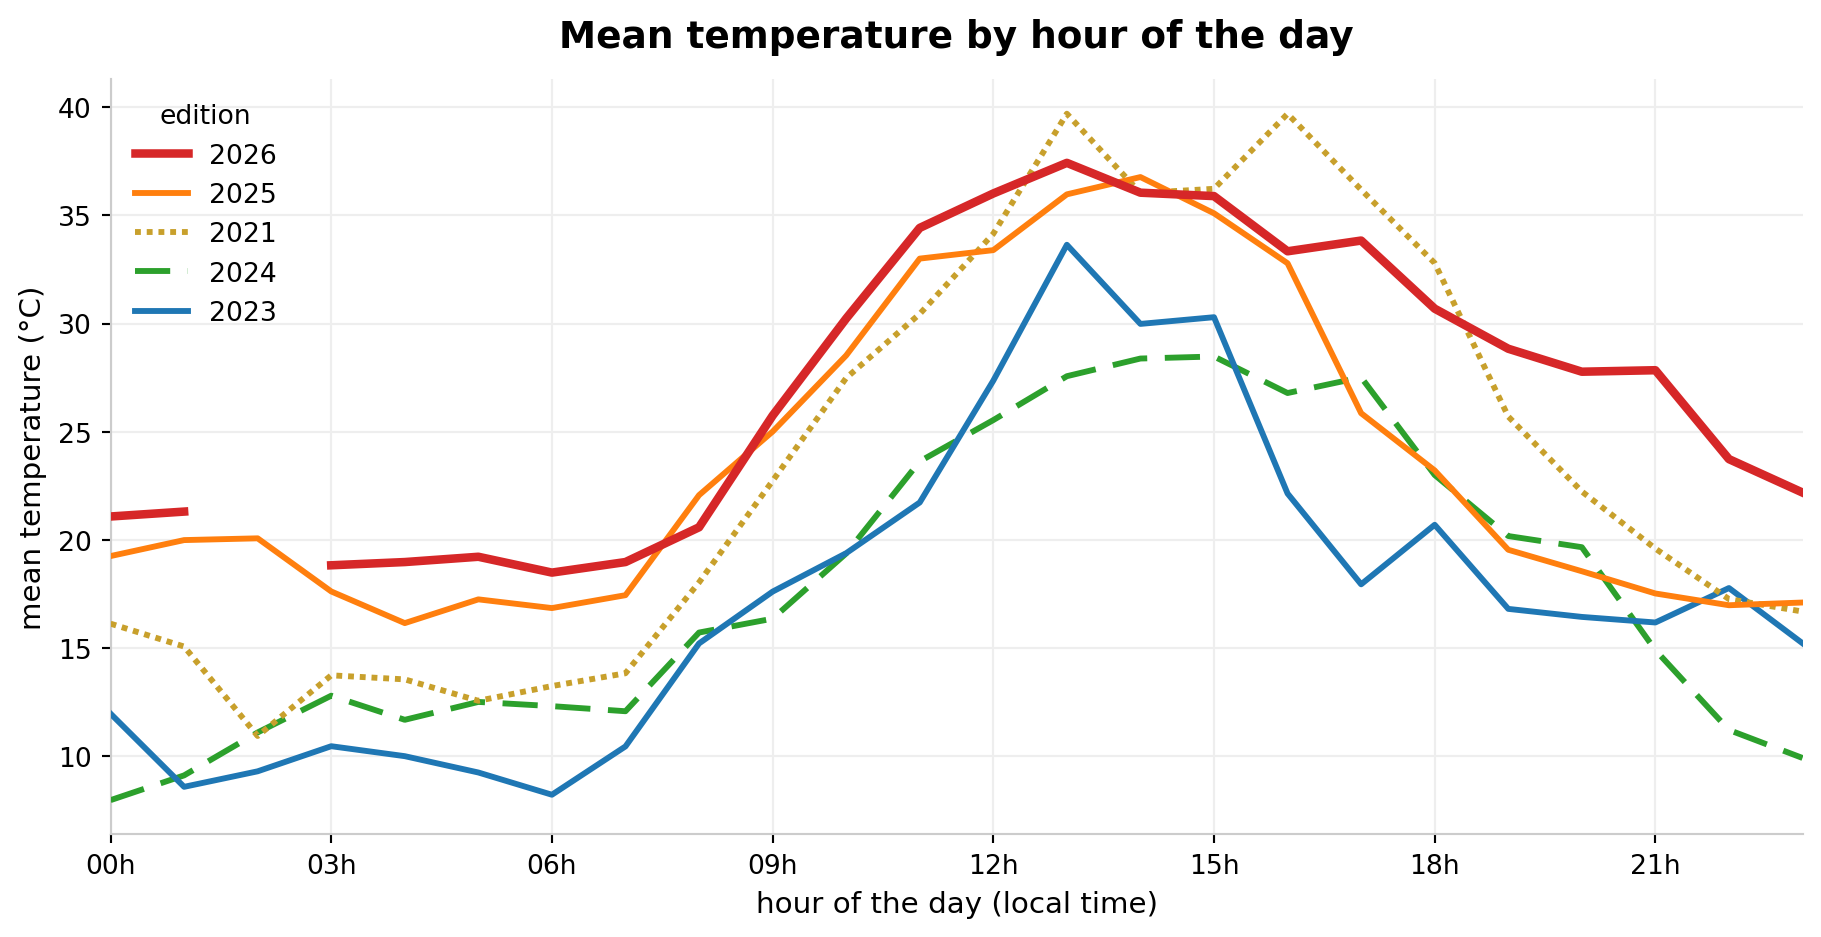
The 2026 line has a gap between 2 and 3 a.m. because I stopped to sleep and there are no readings in that hour.
Where the heat hits
The route goes from Madrid to Barcelona and takes more than a day, so each point is reached at a different time of day depending on the schedule of the edition. To show it, I group the editions by start time: 2021 and 2023 started in the afternoon, around 18:00, and 2024, 2025 and 2026 started in the morning, around 10:30. The hot stretch moves from one group to the other.
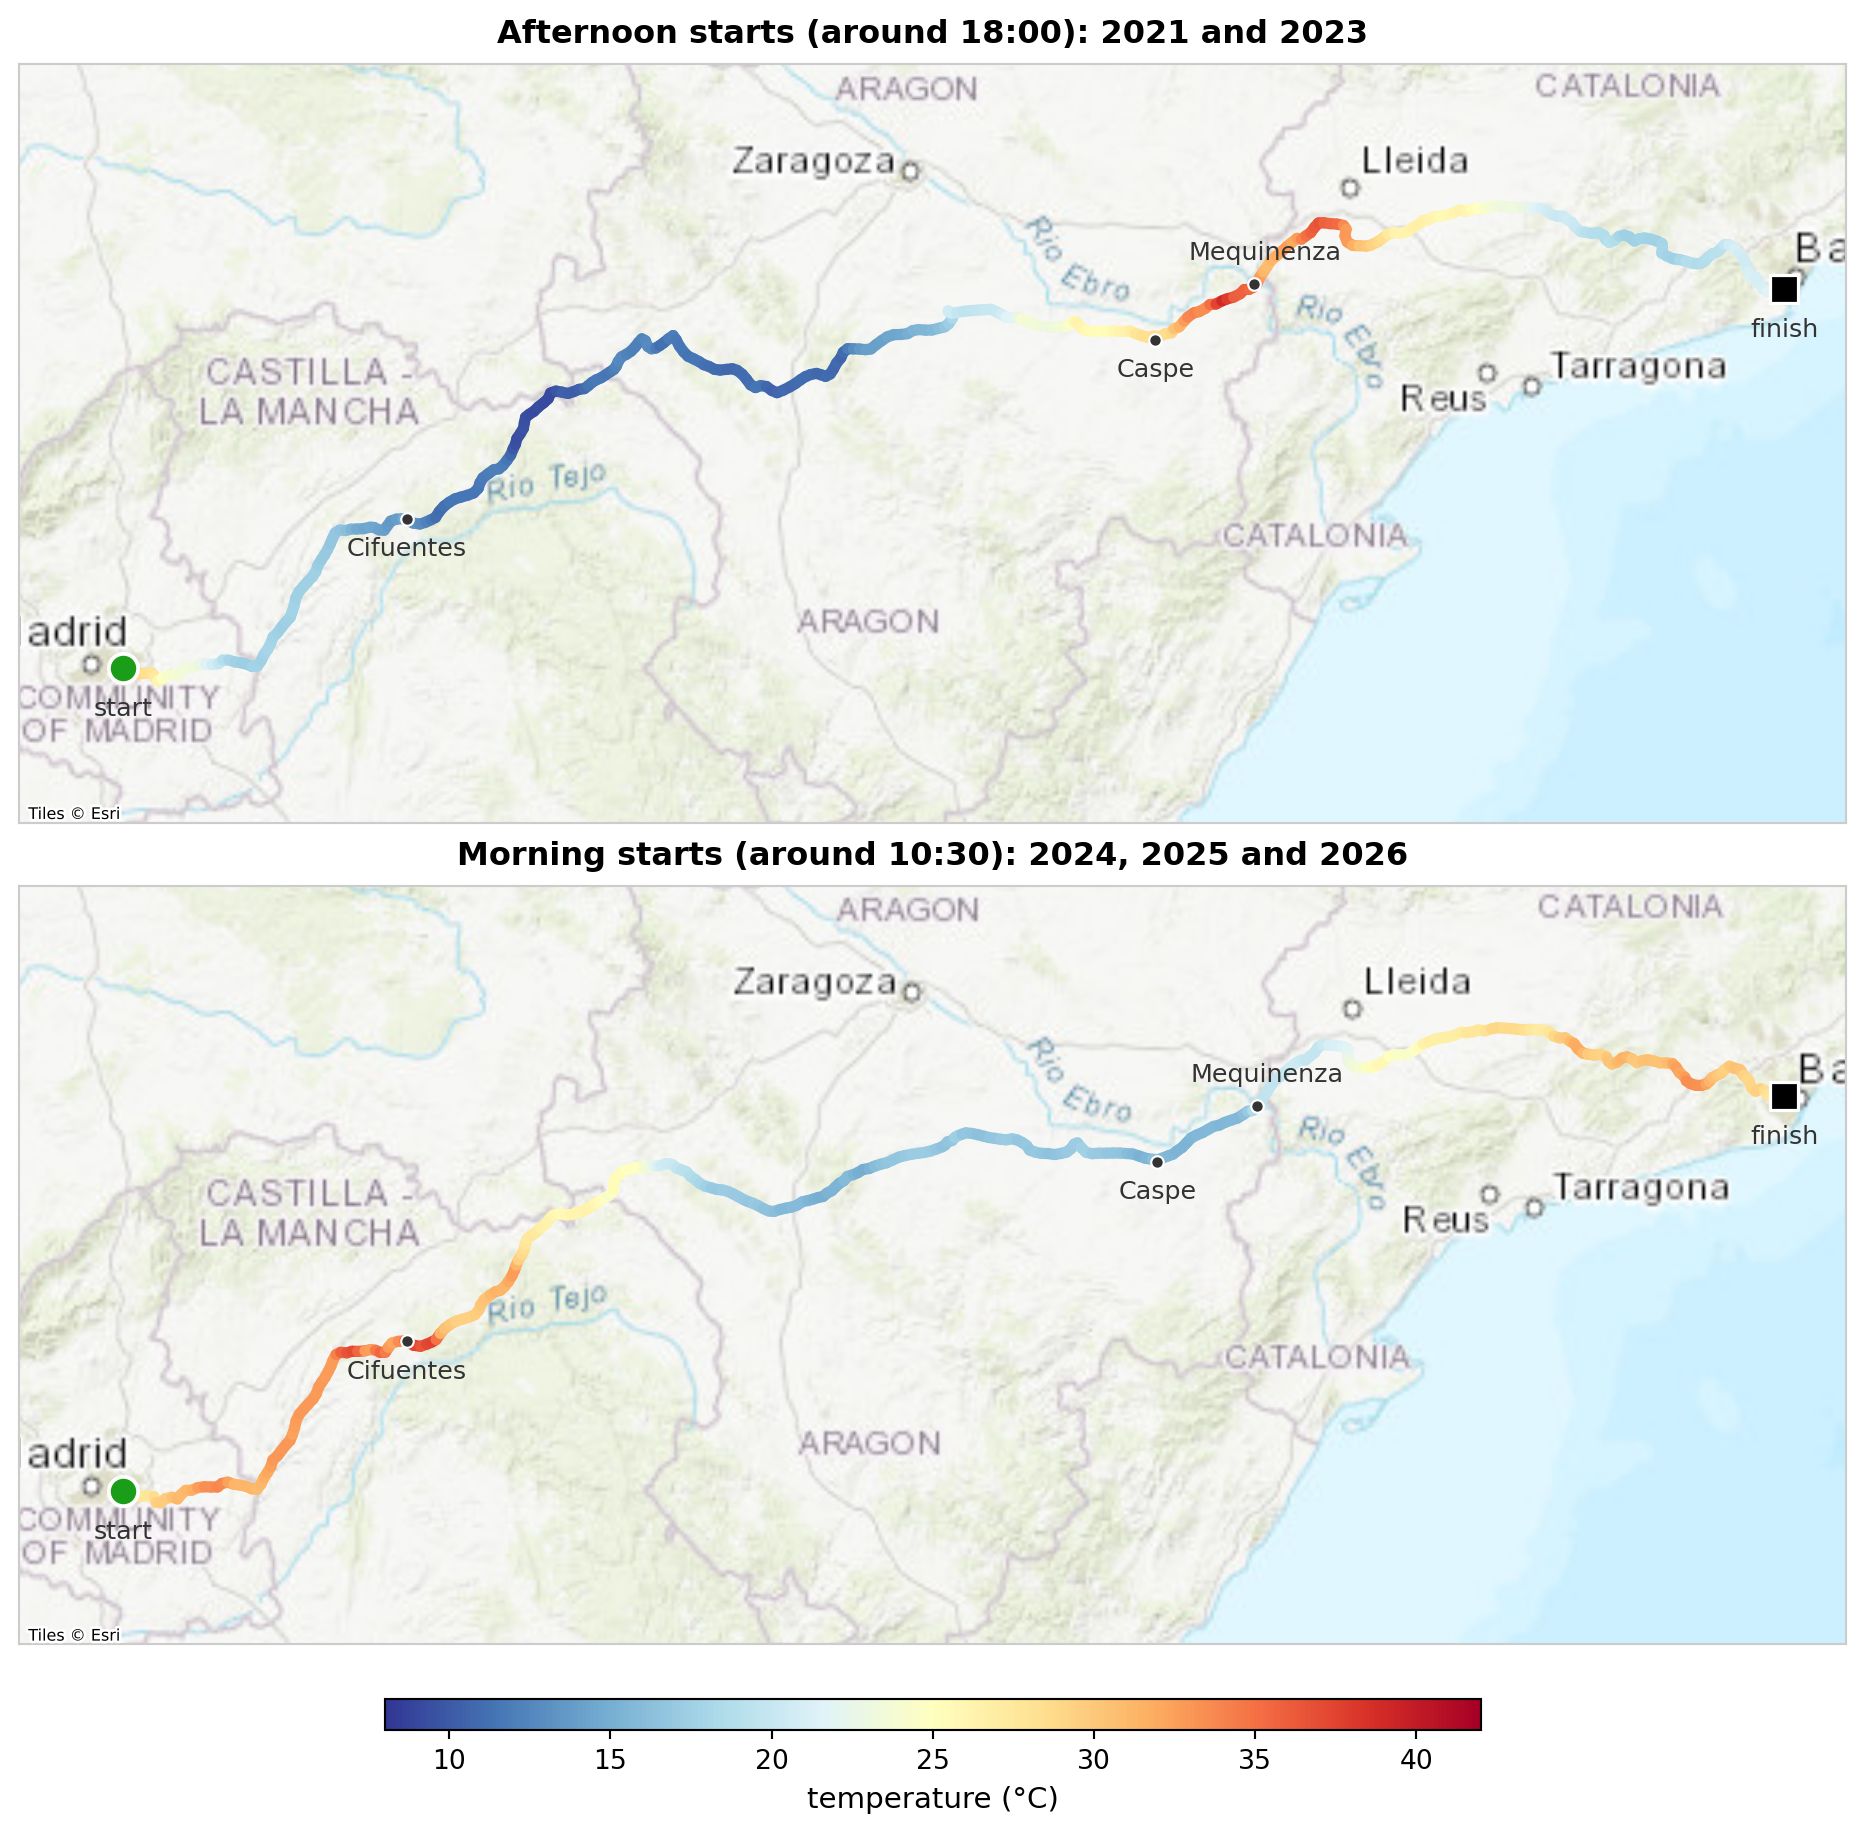
With an afternoon start, the high ground of the first part is crossed at night, in the cool, and the heat is concentrated in the second half. With a morning start it is the opposite: the heat comes at the beginning, on the plateau and the first climbs, and the middle of the route is ridden at night.
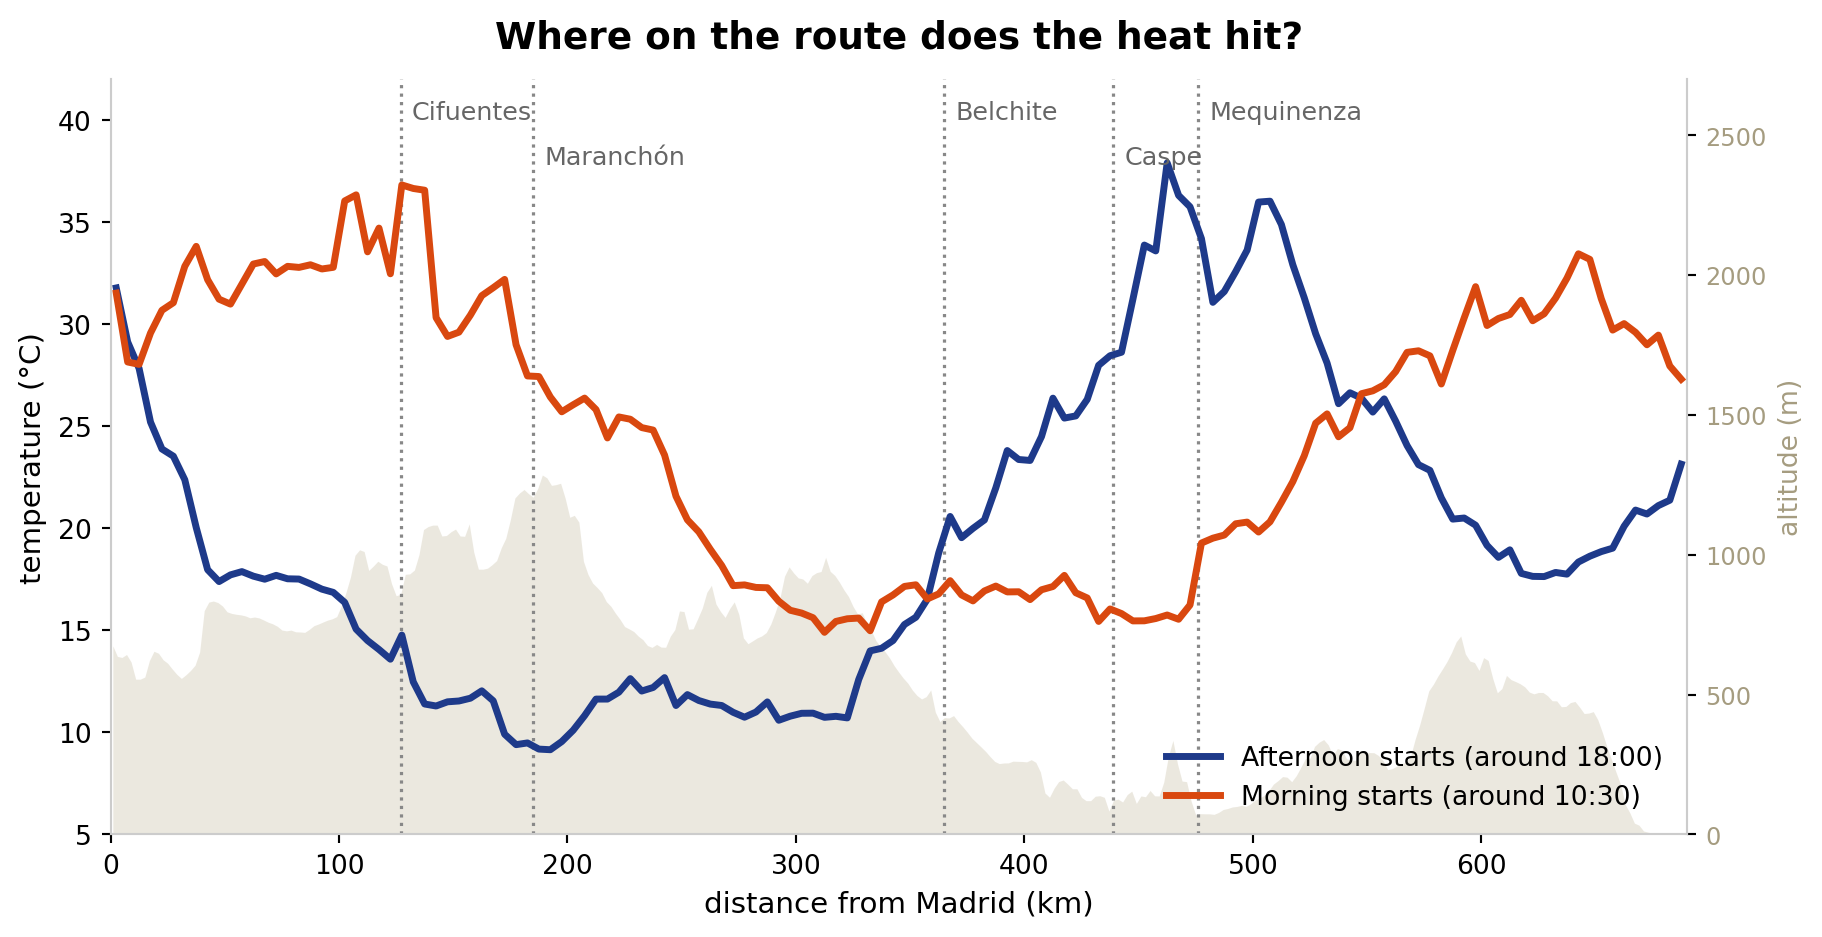
The same information along the route, from the start on the left to the finish on the right. The grey silhouette is the altitude.
- Morning starts. The plateau and the first climbs are ridden in the middle of the day, and the hottest point comes right after Cifuentes, around km 130: 37 °C on average, and 41 °C in 2025. The Ebro depression between Caspe and Mequinenza, the lowest part of the route, is crossed before dawn at about 16 °C. The heat comes back in the last 100 km, on the second afternoon, at around 30 °C.
- Afternoon starts. It is the mirror image. The high ground is crossed on the first night, with the lowest temperatures of the ride, about 9 °C around Maranchón. The Ebro depression is reached at midday of the next day, with the highest heat: 38 °C on average between Caspe and Mequinenza, and 42 °C in 2021.
The high ground around Maranchón, at more than 1,200 m, is ridden at 27 °C by the morning starts and at 9 °C by the afternoon starts. The time at which you reach a stretch weighs far more than its altitude.
2026 against 2025: hotter for longer
2026 and 2025 were by far the two hottest editions, so they deserve a closer look. Both started in the morning, around 10:30, and covered the first half of the route at almost the same times of day, so they can be compared directly. In short: 2026 was clearly hotter in a sustained way, and 2025 only beat it on one count, the highest single reading.
| 2026 | 2025 | |
|---|---|---|
| Mean temperature of the whole ride | 29 °C | 26 °C |
| Median temperature | 32 °C | 24 °C |
| Highest reading | 43 °C | 46 °C |
| Hours at 30 °C or above | about 16 | about 10 |
| Hours at 35 °C or above | about 7 | about 4 |
| Hours at 40 °C or above | about 0.5 | about 1 |
| Mean temperature before dawn (00 to 06 h) | 20 °C | 18 °C |
2026 comes out on top in almost every row. The most telling difference is the median: in 2026 half of the ride was spent at 32 °C or more, while in 2025 half of it was spent at 24 °C or less. 2026 also added up more hours of heat (about 16 against 10 at 30 °C or above, and 7 against 4 at 35 °C or above) and had warmer nights (20 against 18 °C before dawn). The only row that 2025 wins is the highest reading, 46 against 43 °C, a peak that did not last long.
One caveat: 2026 was also a longer ride, about 34 hours against 29, so I was still on the road in the second afternoon, at a time when I had already finished in 2025. Some of the extra hours of heat come from that longer ride. This post measures the heat I rode through, which depends on the weather and on my own schedule.
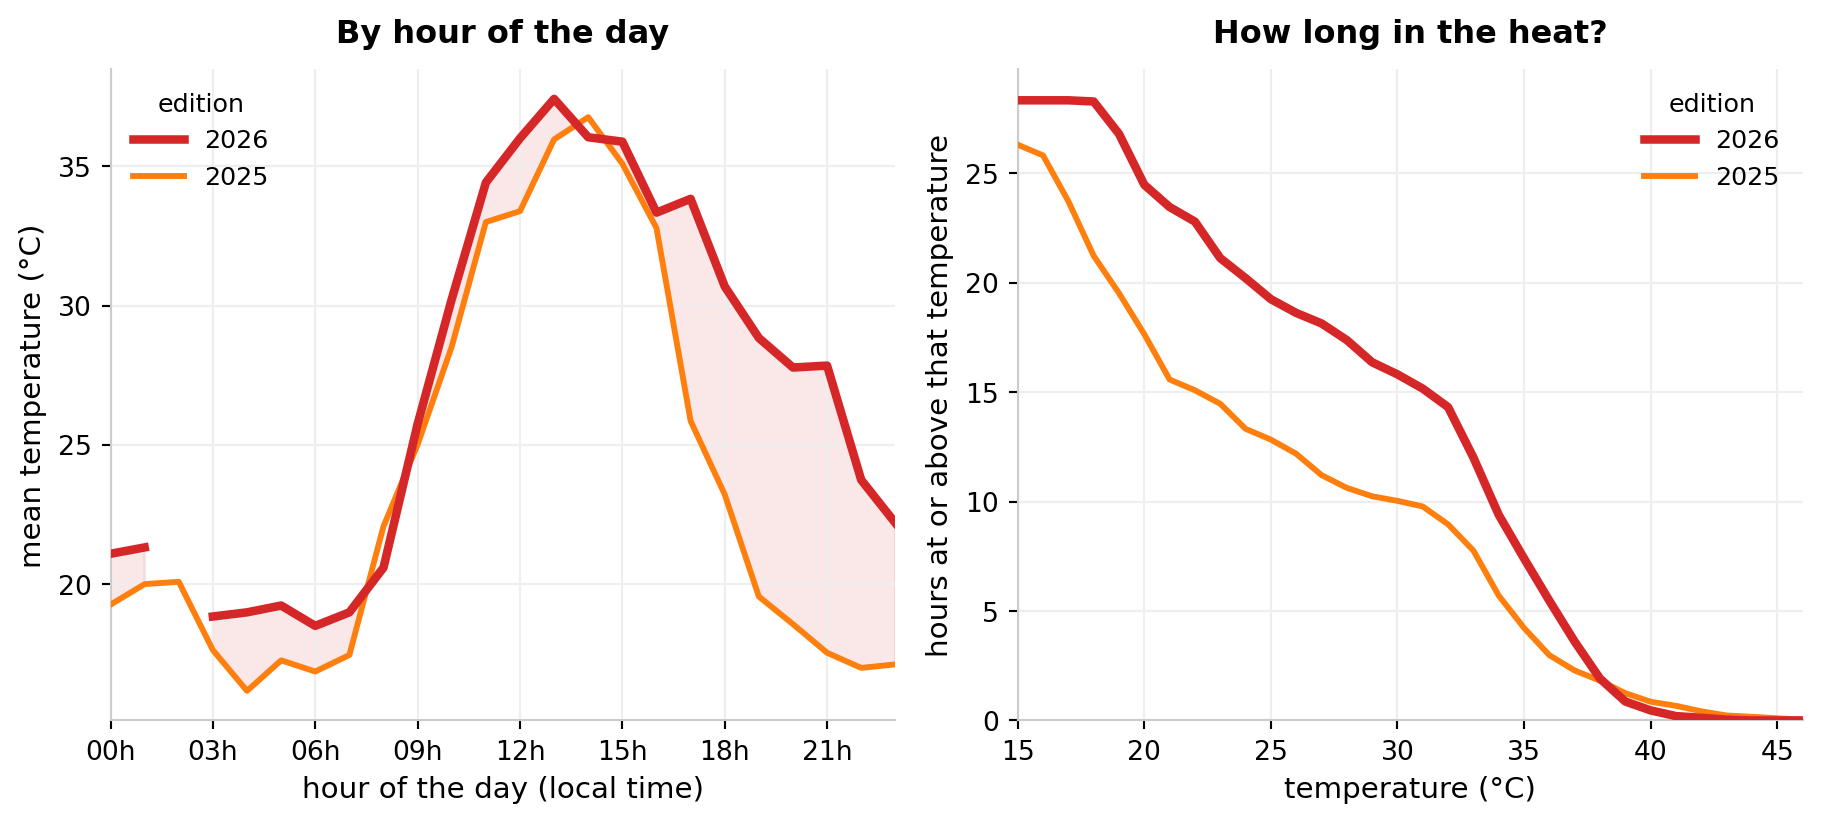
The left panel shows that 2026 was hotter at almost every hour, and that the widest gap opens in the evening and at night, when 2026 hardly cools down. The right panel sums up the time in the heat: for each temperature, the hours spent at or above it. The 2026 line runs ahead of the 2025 line over almost the whole range, so it added up more hours of heat. The exception is the far right, above 38 °C, where the two lines cross: 2025 spent about 40 minutes at 41 °C or above, against 12 minutes in 2026.
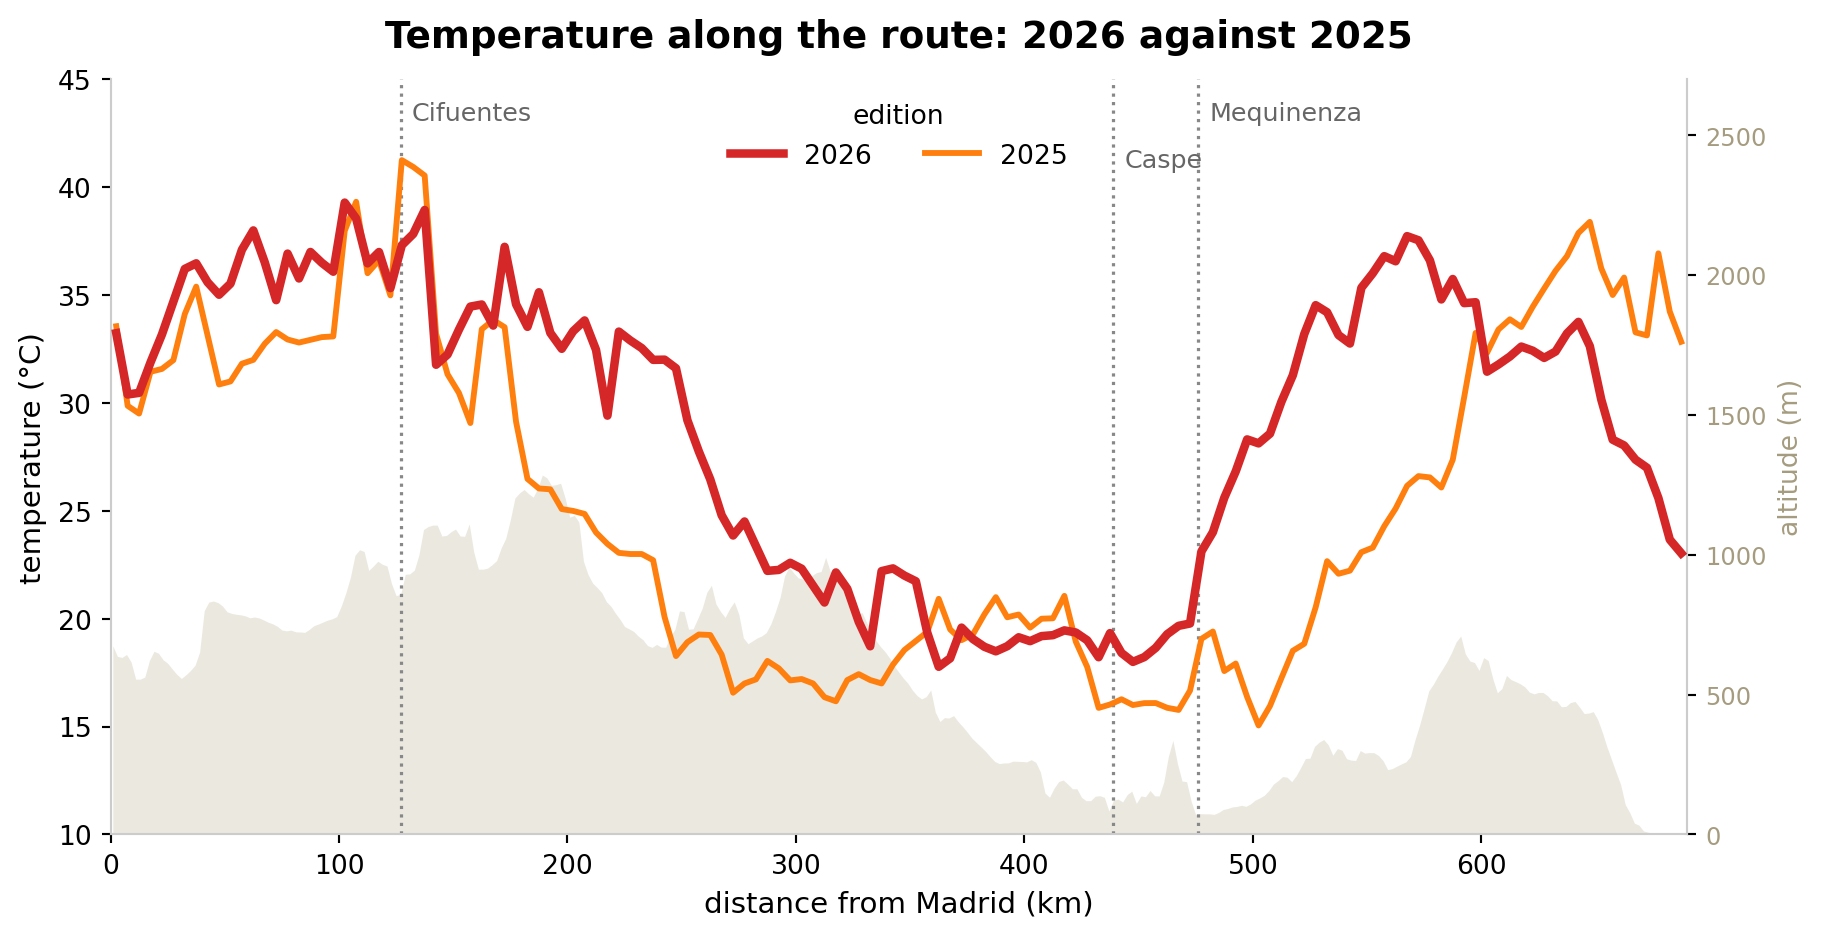
Along the route, the two editions follow a similar pattern: heat at the beginning on the plateau, relief when the high ground and the Ebro depression are crossed at night, and a new rise at the end. The highest peak of 2025 comes right after Cifuentes, and it explains why its highest reading beats that of 2026 even though it was, overall, a cooler edition.
The clearest difference is between km 150 and km 330, which I rode at the same times in both editions, from mid-afternoon to midnight of the first day: 29 °C on average in 2026 against 22 °C in 2025. The first evening of 2026 simply did not cool down.
After that the comparison is less clean, because the two editions are no longer at the same place at the same time. In 2026 I stopped to sleep and reached Mequinenza about two and a half hours later than in 2025. So I rode km 480 to 600 in the middle of the day in 2026, at 33 °C on average, and in the morning in 2025, at 22 °C. In the last 90 km it is the other way round: in 2025 I got there at midday, at 35 °C, and in 2026 in the evening, at 29 °C.
The cold: the other side of the ride
The ride has a cold side too. If 2026 and 2025 were the hot editions, 2024 and 2023 were the cold ones. In 2024 the thermometer dropped to 7 °C, the lowest reading of the five editions, while 2025 and 2026 never went below 15 °C.
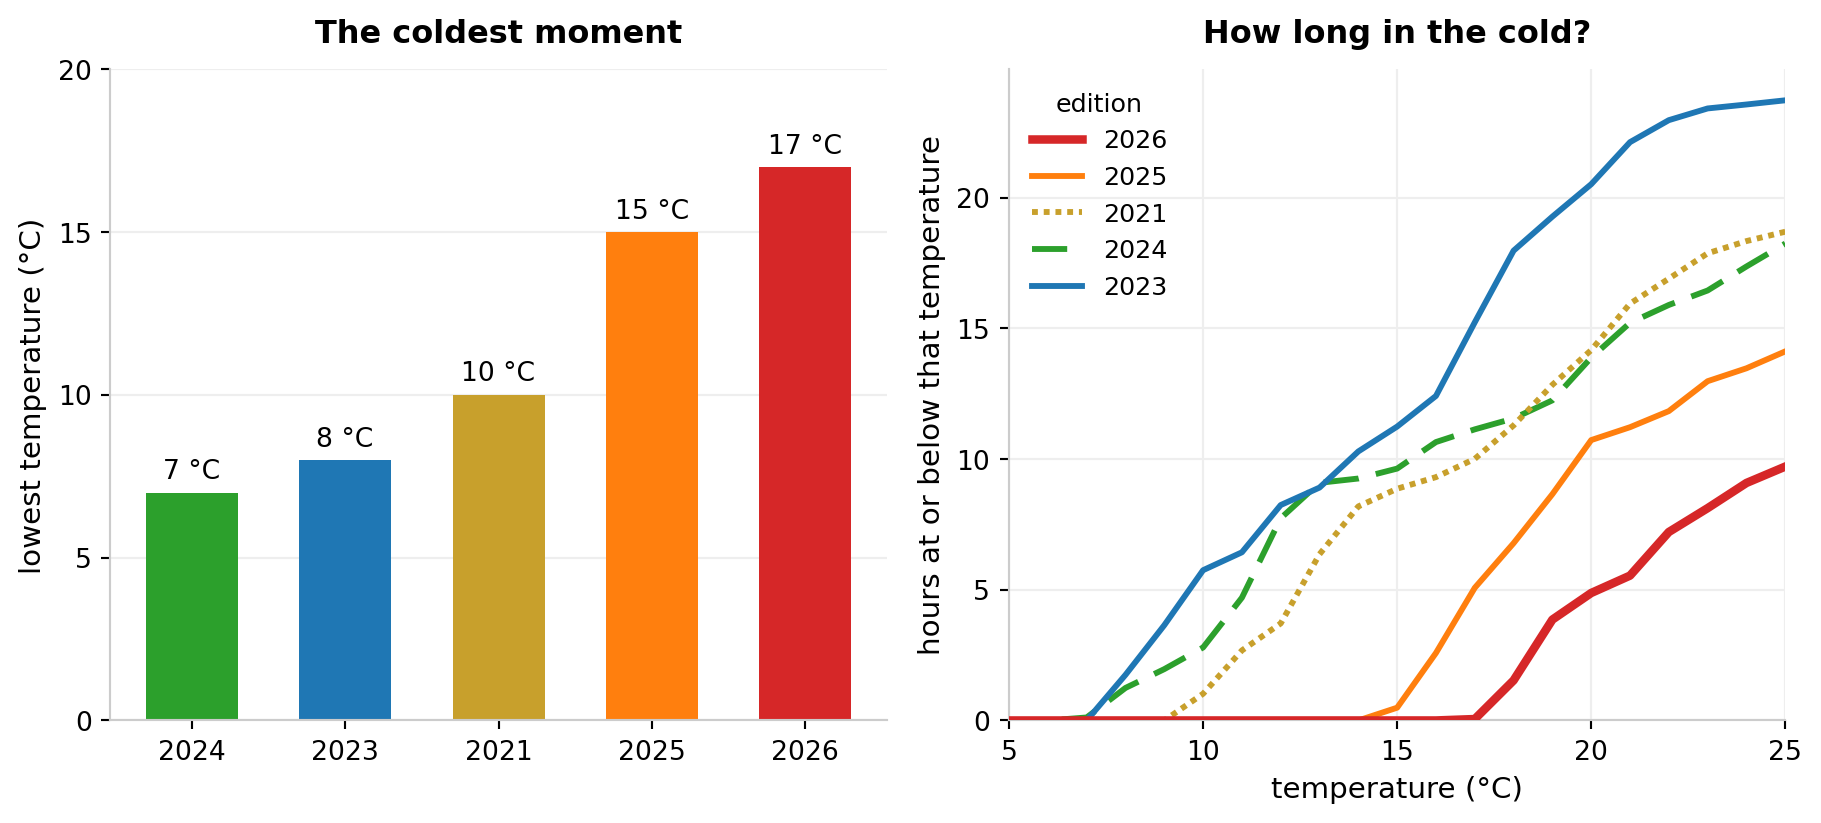
The left panel sorts the editions by their lowest reading. The right panel counts, for each temperature, the hours spent at or below it. The 2023 and 2024 lines climb first: 2023 spent about 11 hours at 15 °C or below and 2024 about 10, several of them under 10 °C. The 2025 and 2026 lines stay on the floor up to 15 °C, because in those editions it simply was not cold. Overall, 2023 was the coldest edition on average, but 2024 had the coldest moment.
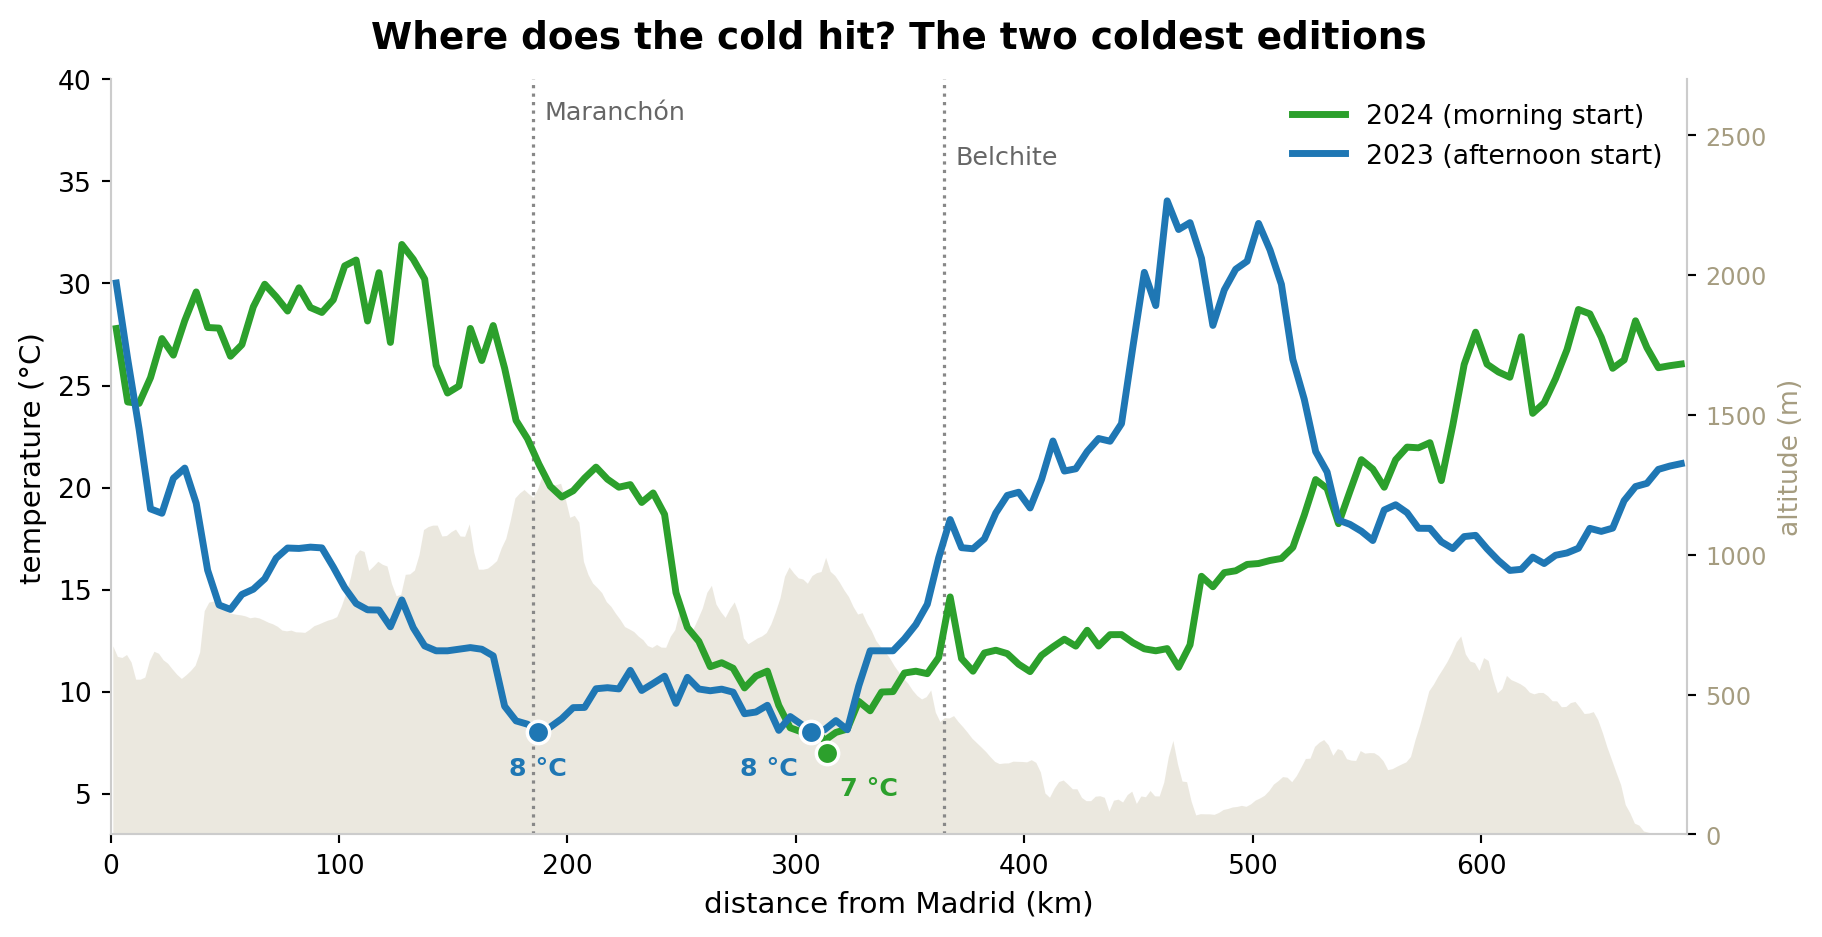
Like the heat, the cold moves with the time at which you reach the high ground.
- 2023, an afternoon start (around 18:00). The cold came early, on the first night: 8 °C between 1 and 2 a.m. on the highest part of the route, at 1,150 to 1,300 m around Maranchón (km 175 to 196). It came back at dawn, again 8 °C, between 5 and 7 a.m. in the hills before Belchite (km 277 to 323).
- 2024, a morning start (around 10:30). The cold waited until the middle of the route: 7 °C shortly before 1 a.m. on the pass before Belchite (km 312, at about 1,000 m).
The recipe is the same in both: night and altitude at the same time. 2025 and 2026 were morning starts too and crossed that pass at night, but they were simply warmer years.
What the thermometer does not say
I was there, and 2024 felt far colder than 2023, much more than one degree of difference suggests. My bike computer does not record wind, so I looked it up in the historical weather data of Open-Meteo for the place and the hours of each cold stretch.
| Wind | Gusts | Apparent temperature | |
|---|---|---|---|
| 2023, around Maranchón | 8 km/h | 10 km/h | 8 °C |
| 2023, before Belchite | 8 to 10 km/h | 14 to 18 km/h | 8 °C |
| 2024, pass before Belchite | 15 to 20 km/h | 33 to 36 km/h | 5 to 6 °C |
In 2024 the wind was about twice as strong, from the north-west, with gusts above 30 km/h. With almost the same thermometer reading, the apparent temperature was about 3 °C lower than in 2023. And that is for someone standing still. Riding at 20 km/h adds more wind on top.
These wind figures come from a weather model with a grid of several kilometres, so take them as a guide. The temperatures of the model for those hours are within 1 to 2 °C of my bike computer’s.
In short
- 2026 was the hottest of the five editions. It had the most hours of heat: about 16 at 30 °C or above. The hottest moment belongs to 2025, with 46 °C, which comes second overall at a clear distance.
- 2024 and 2023 were the cold ones. 2023 was the coldest on average. 2024 had the lowest reading, 7 °C on the pass before Belchite, and the wind made it feel colder still.
- Heat and cold move with the start time. With a morning start the heat hits at the beginning, with its peak right after Cifuentes, and comes back at the end. With an afternoon start it hits in the second half, in the Ebro depression. The cold falls on whatever high ground each edition crosses at night.
- The time of day matters far more than the altitude. The same high ground is ridden at 27 °C or at 9 °C depending on when you get there.
All the readings come from my bike computer, the same device in the five editions. The sensor of a bike computer reads high in direct sun, so the figures are approximate. The trends are consistent.
No GitHub account? Write to me at .