Why RaceFit, the rider selector born at Ben-Gurion University and Israel-Premier Tech, would not help a sports director
Also available in Spanish.
A WorldTour team has between 26 and 30 riders and starts 6 to 8 of them in each race. Choosing them is the sports director’s job, and machine learning can improve that choice. In 2024, a group from Ben-Gurion University of the Negev and Israel-Premier Tech (today NSN Cycling Team) published RaceFit in PLOS ONE (Sagi et al., 2024), a machine-learning system that ranks a team’s riders for an upcoming race and claims up to 80% precision. However, this model would not help any sports director in their job.
What RaceFit does
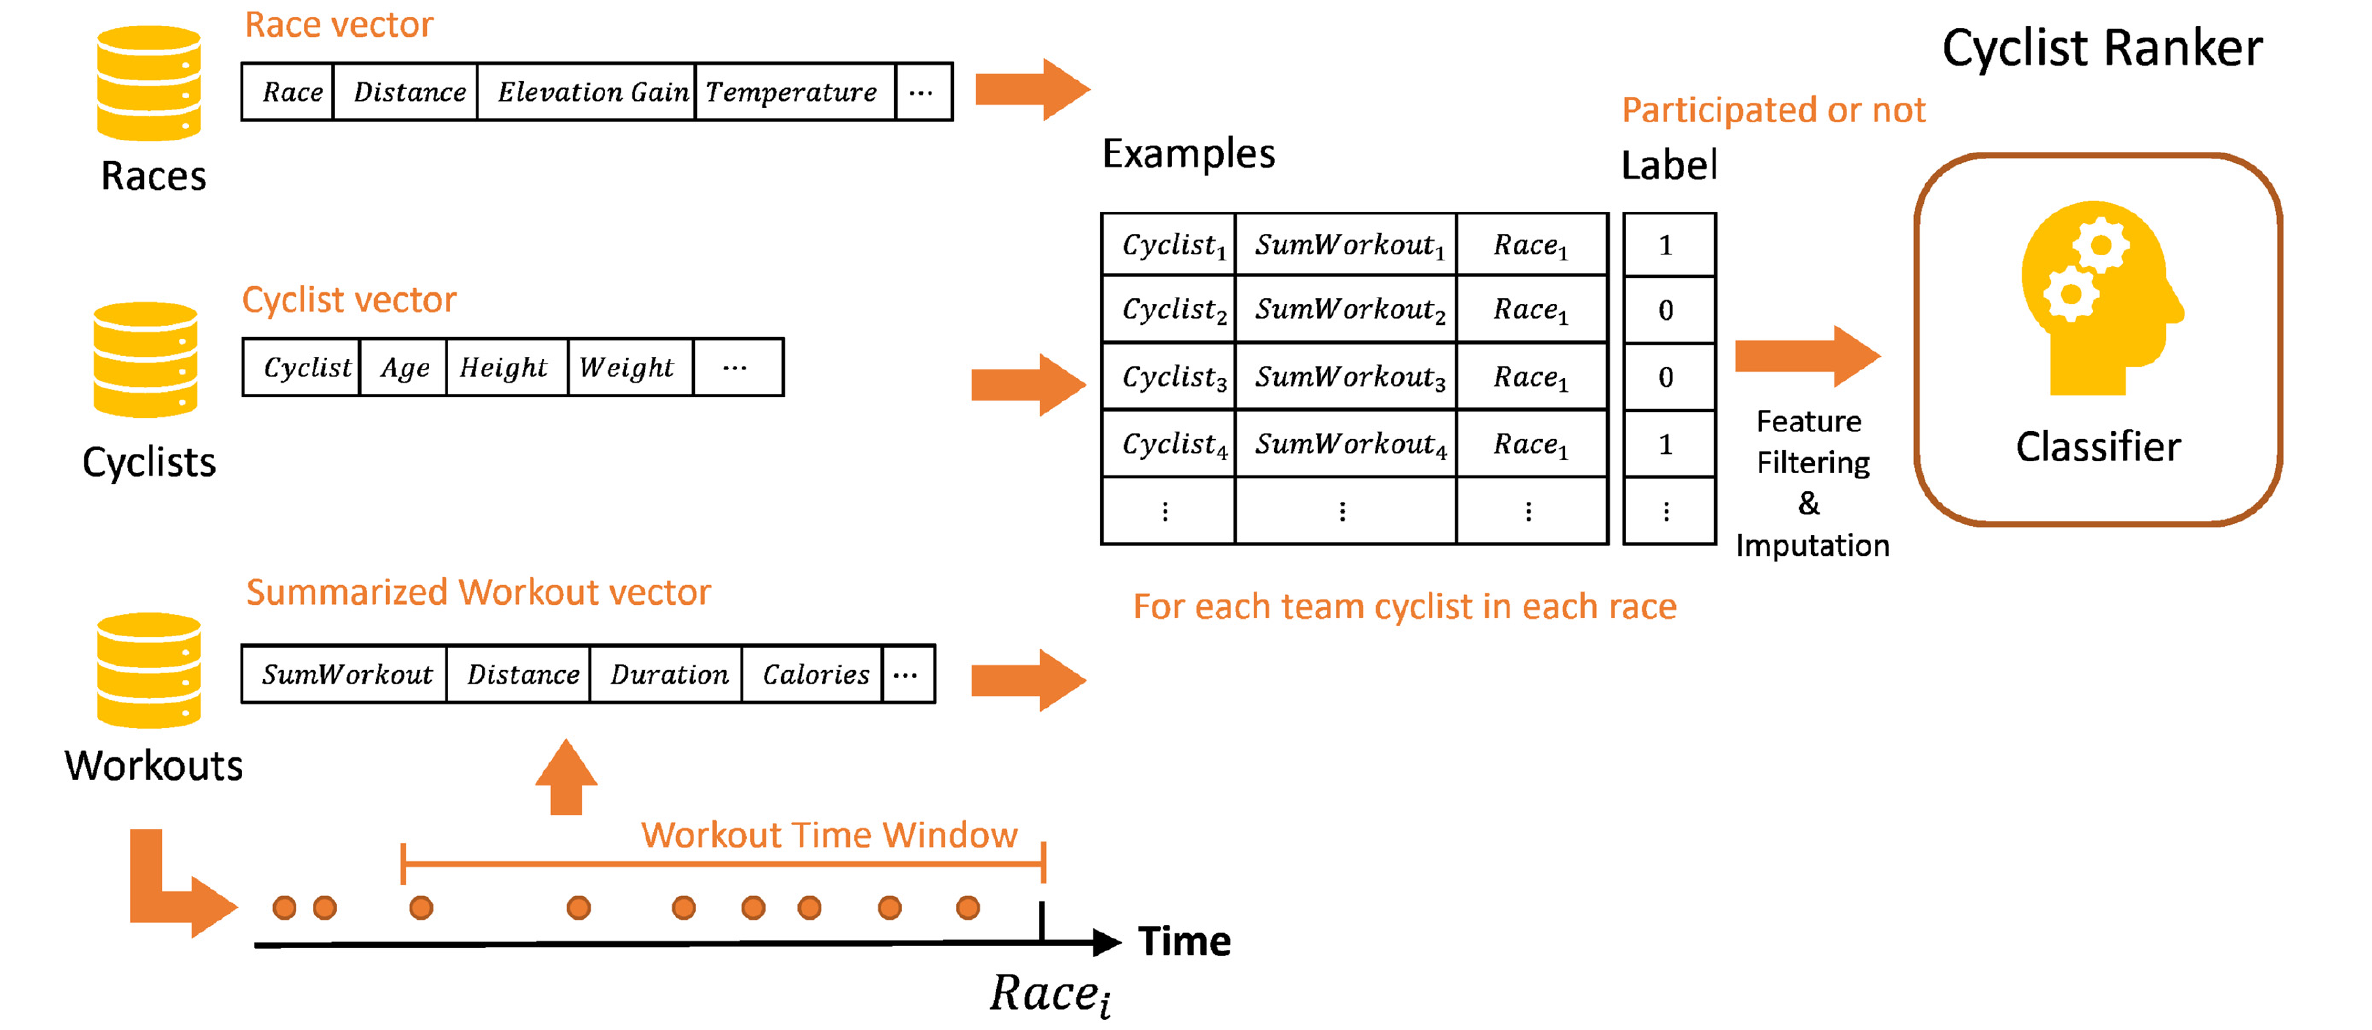
RaceFit is a decision-support tool for the sports director. You give it an upcoming race and it returns the team’s roster ordered from most to least recommended for that race, with a score per rider. To build that order, the system learns from the team’s own past line-ups, together with what each rider has trained in the previous weeks and what the race is like. The authors present it as a recommender, like the ones that suggest films or songs, applied to choosing riders.
The paper uses data from 583 riders, 94,000 Training Peaks workouts and 373,000 Strava workouts from late 2016 to 2022, and 6,000 races from Pro Cycling Stats from 2010 to 2022. Three teams are evaluated: Israel-Premier Tech (with Training Peaks and Strava) and Jumbo-Visma and Groupama-FDJ (with public Strava only).
The system works in three steps.
- Modelling: from sensors to records. For each past race of the team and each rider on the roster, a record is built with three blocks: the rider (age, weight, points, how many times they have raced with the team), their workouts in the previous five weeks (kilometres, hours, elevation, calories) and the race of that record (distance, elevation, number of stages, category). Each record is assigned an answer: 1 if that rider was lined up in that race, 0 if not.
- Training: learning from past line-ups. With thousands of records and their answers, an algorithm (CatBoost, the one that worked best of the four they tried) learns the characteristics of the records that tend to carry a 1. The time order is respected: for each race, a model is trained only with the earlier races.
- Predicting: score, rank, recommend. For a new race, each rider’s record is filled in together with the upcoming race, the algorithm gives it a score between 0 and 1, and the roster is ranked. The director asks for the n riders needed plus k backups, 6 + 2 for example, and decides. A second version does the same stage by stage and averages the stage scores into a single one per race.
Problem 1: it learns to imitate you
The first thing to look at is what the model is trying to predict, that is, the target variable. In machine learning that variable is called the label, and it is the answer attached to each training example. Here the label is whether the rider was lined up in that race. The model therefore learns the sports director’s selection patterns, with their habits, biases and mistakes included. The paper presents the output as the probability that the rider “fits” the race and as “the best possibility of success”. But that is not true: the output of the model is the probability that the rider is lined up in the race, which is a different thing. In other words, the model’s output imitates the sports director’s decision; it does nothing to improve it. The training data contain no performance result at all: no finishing position, no points, no team objective met.
The paper claims 80% precision. That means that, of the riders RaceFit puts at the top of its list, eight out of ten match the ones the director chose. A good score means a good imitation, and tells you nothing about the quality of the line-up.
It is as if you taught a new assistant to make line-ups by showing them all of yours from the last six years and nothing else. They will learn to look like you. If you tend to leave out a rider who performs in cold Classics, they will leave that rider out too. The purpose of a recommendation model, however, should be to improve the selection, to make you see the things you do not see. A system that imitates the selector is only good for replacing them, and if the selector is wrong, the system is wrong in the same way, with no way of knowing it, because it has never seen a good selection marked as good or a bad one marked as bad.
Problem 2: it picks riders one at a time
The model scores each rider separately and the seven with the best score go to the race. A line-up is something else: a sprinter needs a train, a leader needs domestiques around them and climbers at their side, a Classic calls for different riders from a Grand Tour. Scoring one at a time, the model can return seven climbers for a flat race and has no way of noticing. And although the paper mentions the methods from other sports that choose the formation as a whole, it dismisses them because “the cycling teams’ structure is similar in all cycling races” (page 5). Line-ups are built just the other way round: the structure changes with the race.
Problem 3: what it has really learned is your calendar
There is a way to ask a model which data it looks at most to decide. It is called feature importance, and appendix S3 of the paper shows it. With the two most reliable methods (CatBoost’s own and the SHAP values), and in all three teams, two pieces of data dominate by a wide margin: how many kilometres this race is from the place of the last one the rider raced, and how many weeks ago they raced.
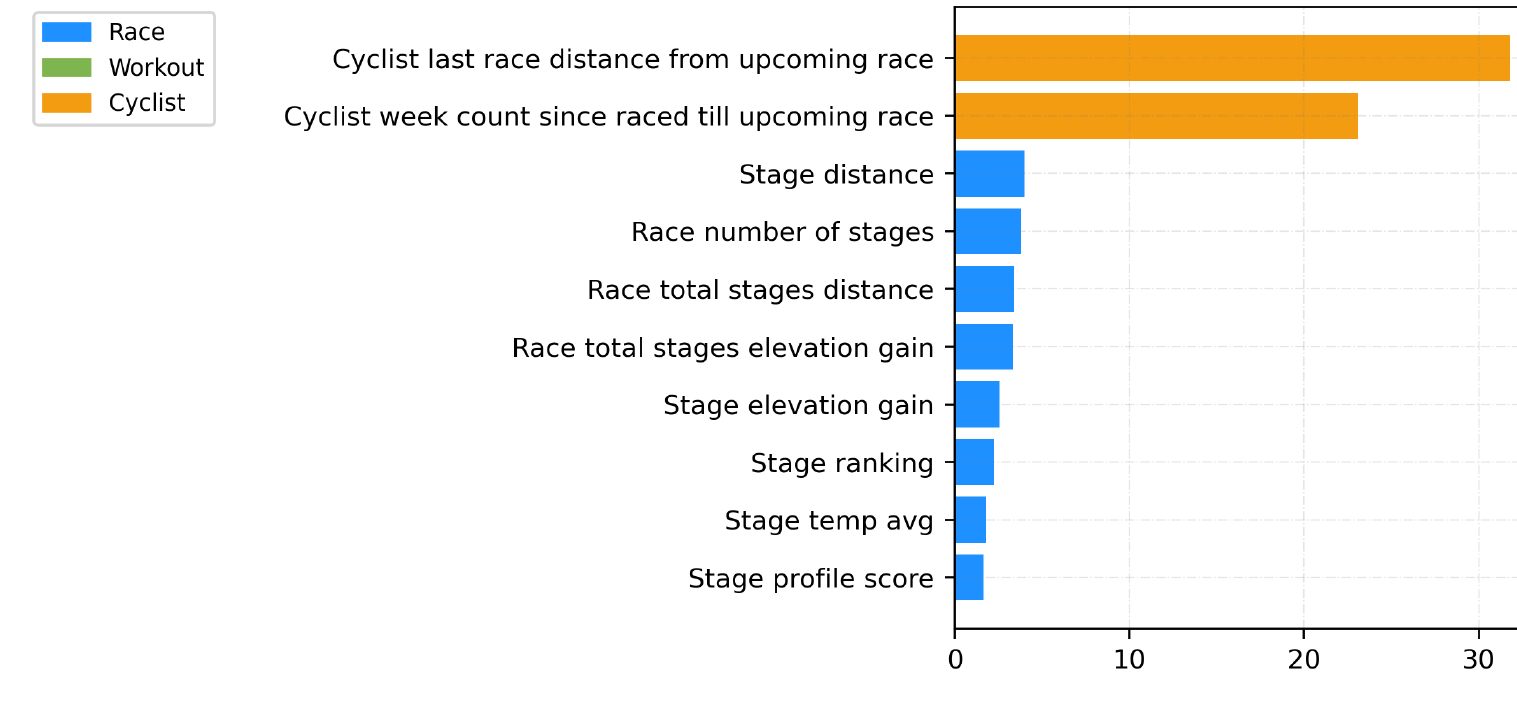
Those two pieces of data are your calendar of racing blocks. A rider who finished in Australia this week does not start in Belgium next week, and one who is in the middle of a block stays in the block. It is the part of the decision that needs no model, because you already know it. The workout data, which are the paper’s selling point (the watts from Training Peaks and Strava), do not appear in the top ten with either method. This also explains one of the paper’s findings: Training Peaks and Strava “perform the same” because the workouts barely move the list.
Problem 4: the evaluation does not hold up
This is the most technical part, and also one a director can follow with a little guidance.
The bar is on the floor. To know whether a model adds anything, you have to compare it with a simple rule: the baseline. The paper uses only one, in two variants: lining up the riders who have raced most often (“popularity”), overall or in the continent of the race. That rule reaches a precision of 0.2, constant along the curve. Picking seven riders at random from a roster of thirty gives 23%: almost the same. RaceFit therefore beats a bar equivalent to chance. Missing are the baselines a director would recognise: repeating last year’s line-up in that race, or choosing among the riders free that week.
Not a single interval. Every number in the paper is a mean over races. A mean of 0.55 can be a model that gets a bit right in all of them or one that gets a lot right in half and nothing in the other half, and for a director that is not the same thing. The confidence interval (between which values the result moves from race to race) is what tells you how far to trust a number, and there is none.
The hyperparameters are chosen on the evaluation set. The model has several free settings: how many weeks of training to use, how to impute the missing data, which algorithm to apply. The paper tries several combinations, keeps the one that scores best on the same races it reports the result on, and publishes that one. That is overfitting to the evaluation: the metric stops measuring the ability to generalise and starts measuring how much the model has adapted to that particular set. The correct procedure is to fix the hyperparameters on a validation set and measure performance only afterwards, on races that played no part in that choice.
Filling in gaps improves too much. When a rider has missing data, the paper fills them in with everyone’s mean. With that alone, the precision of the stage model goes from 0.35 to 0.6 (figure 7b). The mean adds no information, so something else is going on there: most likely the gap itself meant something (an injured rider, a resting one, one with a private Strava) and, without filling in, those records were being thrown away. The paper does not explain it.
The best numbers come from the stage model, and they need checking. The stage version reaches 0.77 precision, against 0.55 for the race version, and the paper attributes it to having more examples. The stages of the same race share a line-up, so those examples are copies of the same information. And there is something worse. From the second stage onwards, the rider’s “last race” is yesterday’s stage, zero kilometres and zero weeks away, and only the riders lined up have that. If the two features that drive the model are computed stage by stage, the model is seeing the answer without meaning to: it predicts who races tomorrow by looking at who raced today.
What the paper does well
Still, not everything is wrong. The problem is real and little studied, and the authors are the first to attack it with a team’s data. The time order is properly respected. Publishing the Strava and PCS part of the data is rare in cycling and lets anyone check what they say, including the above. CatBoost with SHAP is a good toolbox. The flaws are in what the model is asked to learn and in how it is examined.
Six questions for anyone who shows you a selection model
- What is the label? If the model predicts “who you lined up”, it learns to reproduce your past decisions. Ask for a label tied to performance: UCI points, finishing positions, or whether the team’s objective in that race was met.
- Does it score individual riders or complete line-ups? A sprinter without a train, or seven climbers in a flat race, can look good in an individual ranking and be a bad line-up. The unit of evaluation is the team that goes out on the road.
- What baseline is it compared against? Ask for bars you recognise: last year’s line-up in that race, the riders free that week, or your own choices. If the only bar is “popularity” or chance, the win is easy to get.
- What is the interval from race to race? A mean of 0.55 can be a stable model or one that gets a lot right in some races and nothing in others. Without a confidence interval or a spread, there is no way to know how far to trust the number.
- Which variables does the decision rest on? Ask for a feature importance (SHAP or the algorithm’s own). If the calendar and rest dominate, the system is reproducing your schedule; if load, race profile or performance history dominate, there is something to look at.
- Has it been evaluated forward, in real time? The serious test is a season in which the recommendation is saved before each race and only afterwards compared with the actual line-up and with the result. Evaluating on the past, with the hyperparameters already tuned to those same races, is not enough.
If you run a team and someone presents you with a selection model, these are the questions you should ask them. Helping teams ask them is part of what I do.
Reference
Sagi, M., Saldanha, P., Shani, G., & Moskovitch, R. (2024). Pro-cycling team cyclist assignment for an upcoming race. PLOS ONE, 19(3), e0297270. doi:10.1371/journal.pone.0297270. Figures reproduced under the CC BY 4.0 licence.
No GitHub account? Write to me at .