What predicts a DNF in the Transcontinental Race? The first 48 hours
ultra-dnf
research
A survival analysis of 568 solo riders of the Transcontinental Race No10 and No11: women and men abandon at the same rate, and the time stopped in the first 48 hours predicts who finishes.
In ultracycling, reaching the final checkpoint is the victory, whatever the position. In the Transcontinental Race (TCR), a self-routed and unsupported race across Europe, close to half of the solo riders who start do not finish.
This post is the long version of the paper I presented at the Science & Cycling Conference 2026. It asks two questions. Do women and men differ in their risk of abandoning the race (a DNF, “did not finish”, which the TCR calls scratching)? And does the way a rider behaves in the first 48 hours predict whether they will finish?
The short answer: sex made no detectable difference to the risk of abandoning. Men rode about 10% faster, and women and men stopped for the same time. What predicted a later DNF was the first 48 hours: each extra hour stopped raised the risk by about 13%, and each extra km/h of moving speed lowered it by about 9%.
The data
I used the public replay tracking of the TCR No10 (2024) and No11 (2025), published by Follow My Challenge: 568 solo riders, 81 women and 487 men. The sex of each rider and whether they scratched come from the same source.
| Edition | Women | Women who scratched | Men | Men who scratched |
|---|---|---|---|---|
| No10 (2024) | 21 | 42.9% | 206 | 47.6% |
| No11 (2025) | 60 | 48.3% | 281 | 44.5% |
| Both | 81 | 46.9% | 487 | 45.8% |
The trackers send a position every few minutes. A straight line between two positions is shorter than the road the rider took, and the error grows with the gap between them, so I rebuilt the distance along the road network with OpenRouteService and computed the speed from it. A rider counts as stopped when that speed falls below 2 km/h, and consecutive stopped positions are merged into one stop. Eight riders with impossible speeds, above 90 km/h, were removed.
Does sex affect the risk of abandoning?
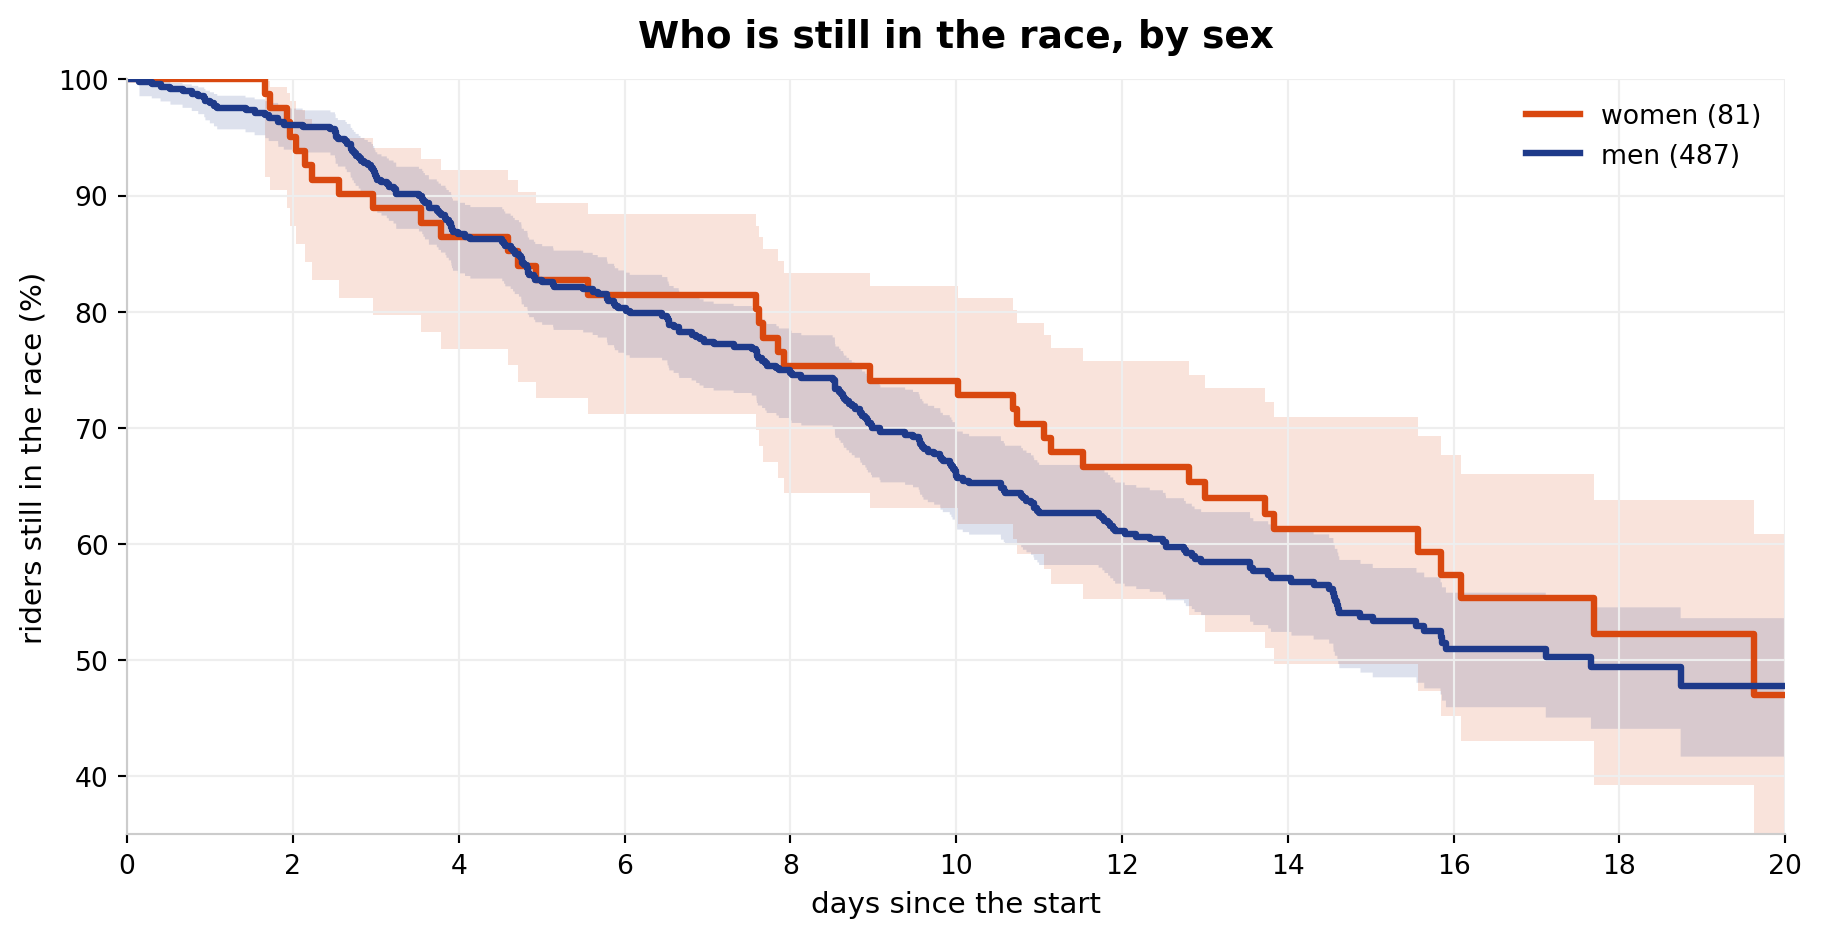
A survival curve shows, at each moment of the race, the share of riders who are still in it. It starts at 100% and steps down each time a rider scratches. Riders who finish leave the curve without lowering it.
The curve of women runs slightly above that of men in the second half of the race, which would mean that women scratch later. But the two bands overlap almost completely, and no test detects a difference:
| Test | Estimate | 95% interval | p-value |
|---|---|---|---|
| Log-rank test, by time | χ² = 0.27 | 0.61 | |
| Log-rank test, by distance | χ² = 0.03 | 0.85 | |
| Cox model, by time | hazard ratio of men 1.06 | 0.75 to 1.50 | 0.75 |
| Cox model, by distance | hazard ratio of men 0.97 | 0.69 to 1.37 | 0.86 |
The log-rank test compares two survival curves as a whole. The Cox model estimates a hazard ratio: how many times higher the risk of scratching is for men than for women at any moment, with 1 meaning the same risk. The models are stratified by edition, so each year keeps its own baseline risk. I ran everything twice, once counting the hours a rider survives and once counting the kilometres, with the same result.
The raw numbers point the same way. In No10 fewer women than men scratched (42.9% against 47.6%), and in No11 it was the reverse (48.3% against 44.5%).
Do women and men ride differently?
Speed is the one thing that differs. The chart shows the mean speed in each 50 km block of the route, for the riders who reached that block.
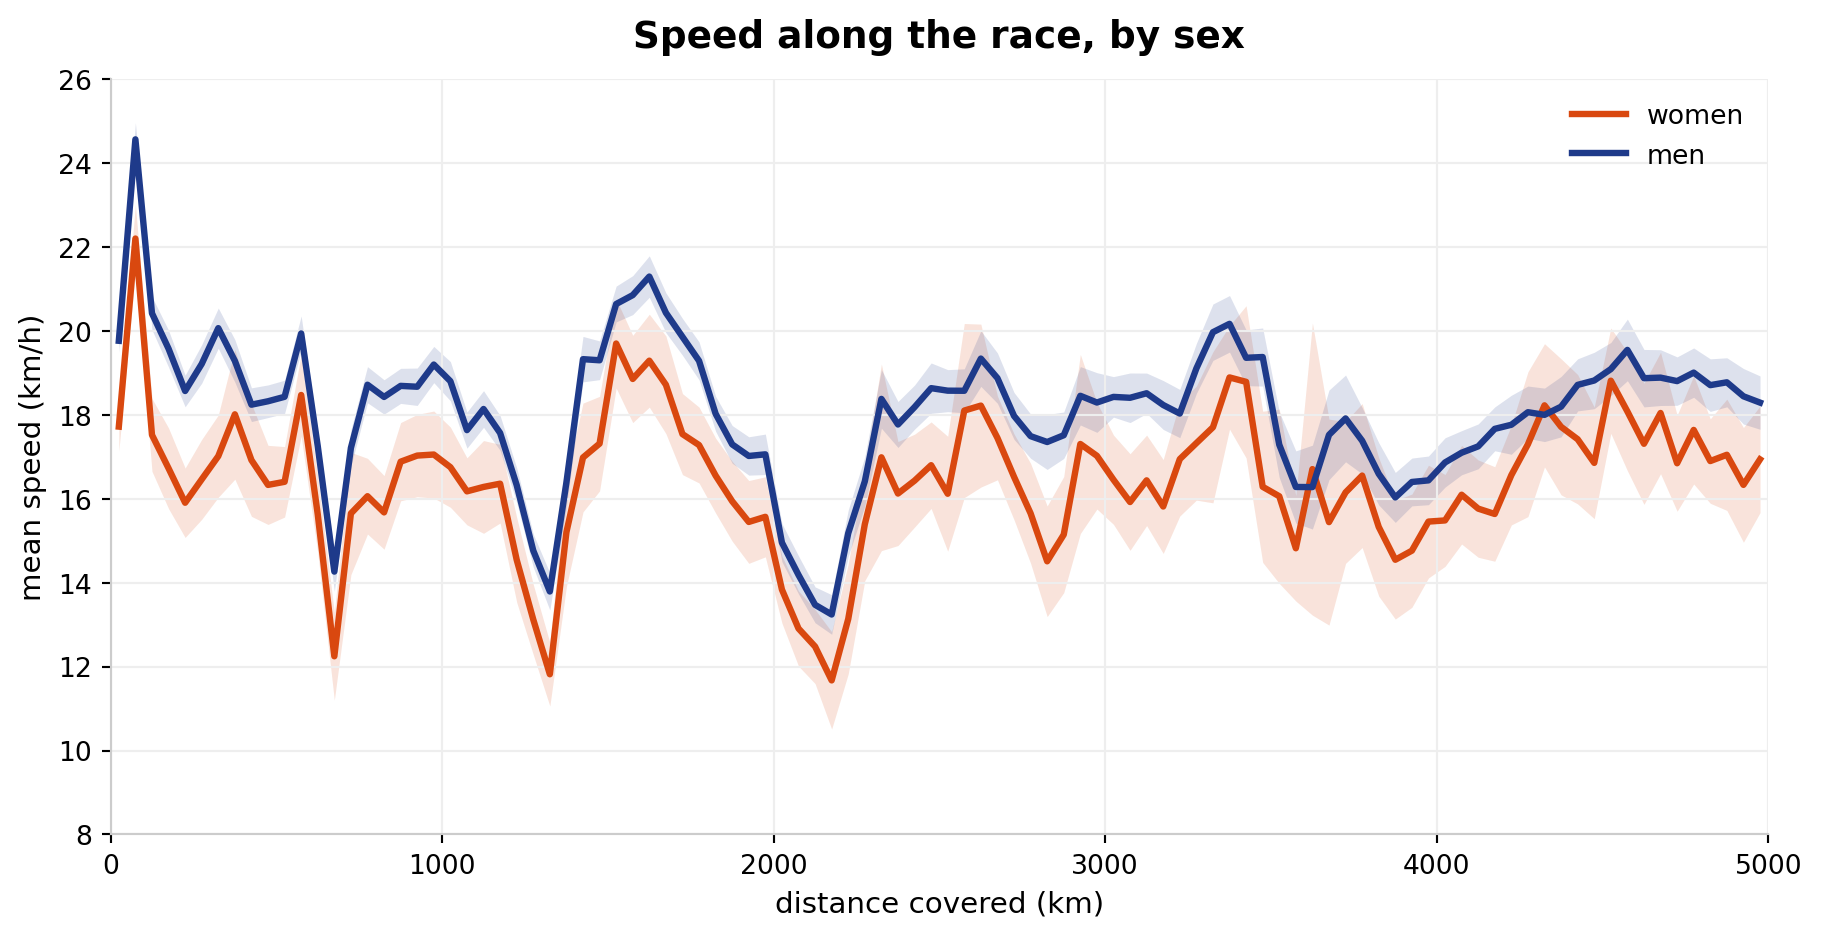
The two lines rise and fall together, and the line of men is above the line of women almost everywhere, by about 10% on average. The bands widen towards the end because fewer riders get that far, so I stop the chart at 5,000 km, the last point with at least 20 women. Over the whole race, men moved about 2 km/h faster than women (95% interval 1.5 to 2.5 km/h), after accounting for the edition.
For the first 48 hours I look at the 545 riders who were still in the race at that point, 468 men and 77 women.
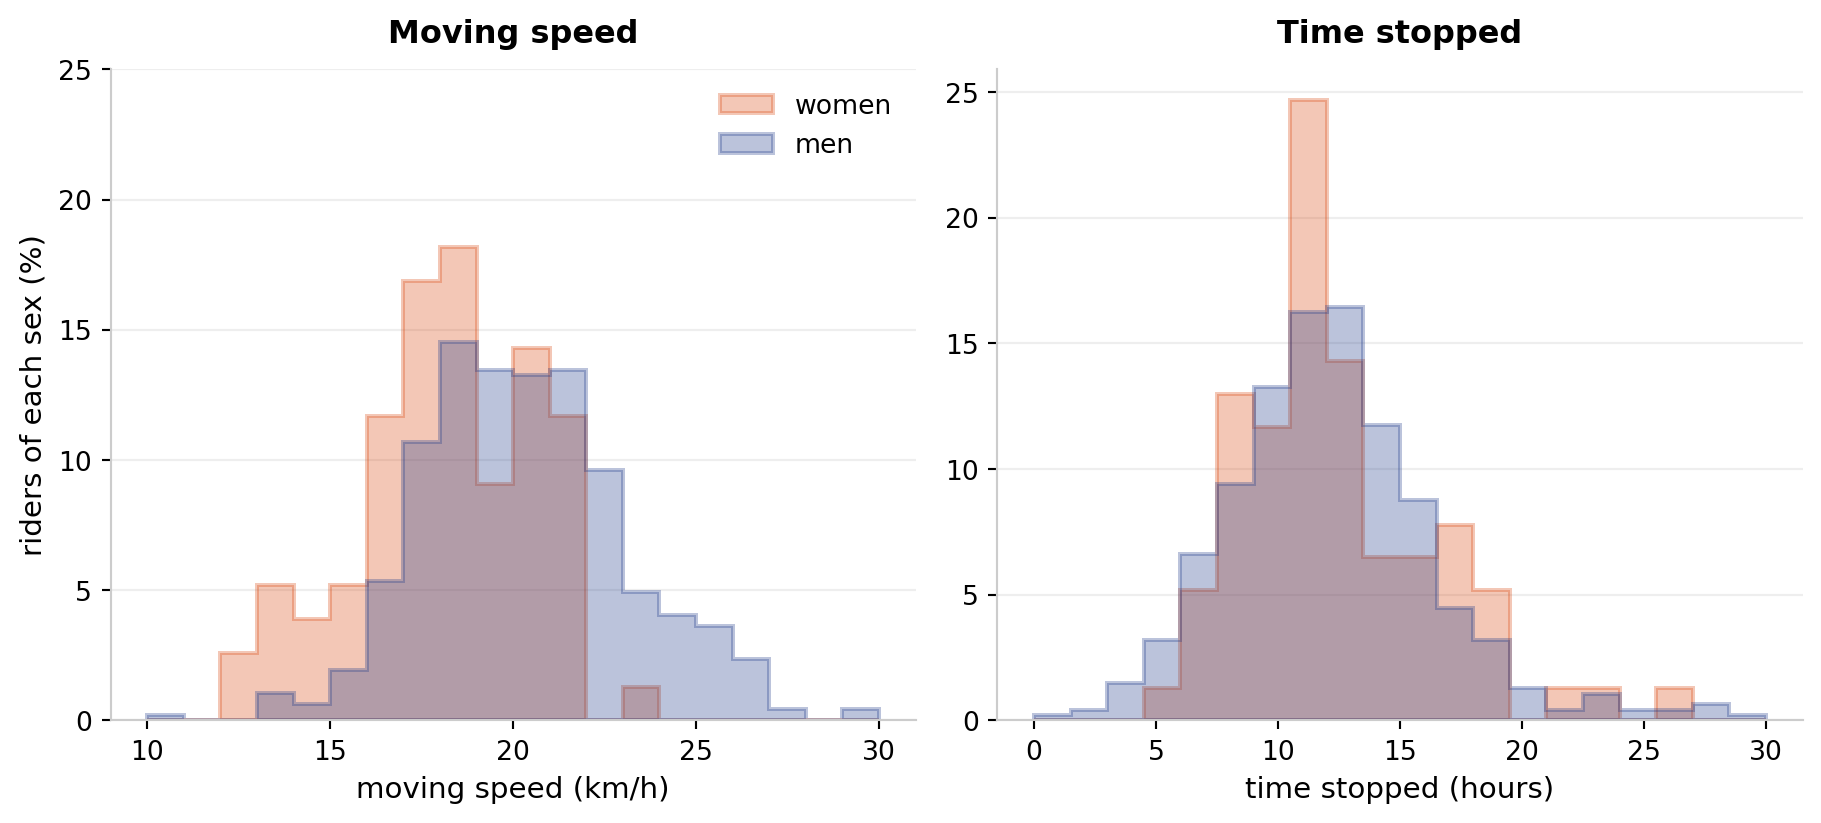
In those 48 hours men moved at 20.3 km/h on average and women at 18.2 km/h, a difference of 1.8 km/h after accounting for the edition (95% interval 1.2 to 2.3 km/h). The time stopped was the same: 12.2 hours for men and 12.4 hours for women on average, with an adjusted difference of 0.05 hours (p = 0.93). The same holds when the stops are split into short ones, under 30 minutes, and long ones: neither differs by sex (p = 0.67 and p = 0.98).
So men ride faster, women and men stop the same, and both abandon at the same rate.
What predicts a DNF?
Sex does not explain who abandons, so I looked at the first 48 hours of each rider: how long they were stopped and how fast they moved.
To keep the question clean I used a landmark design. I take the riders who were still in the race at hour 48, which is 545 of the 568, measure their behaviour up to that point and follow them from there. This way the model only uses what was known at hour 48 to predict what happened afterwards.
I split those riders into three groups of the same size by the time they spent stopped in the first 48 hours.
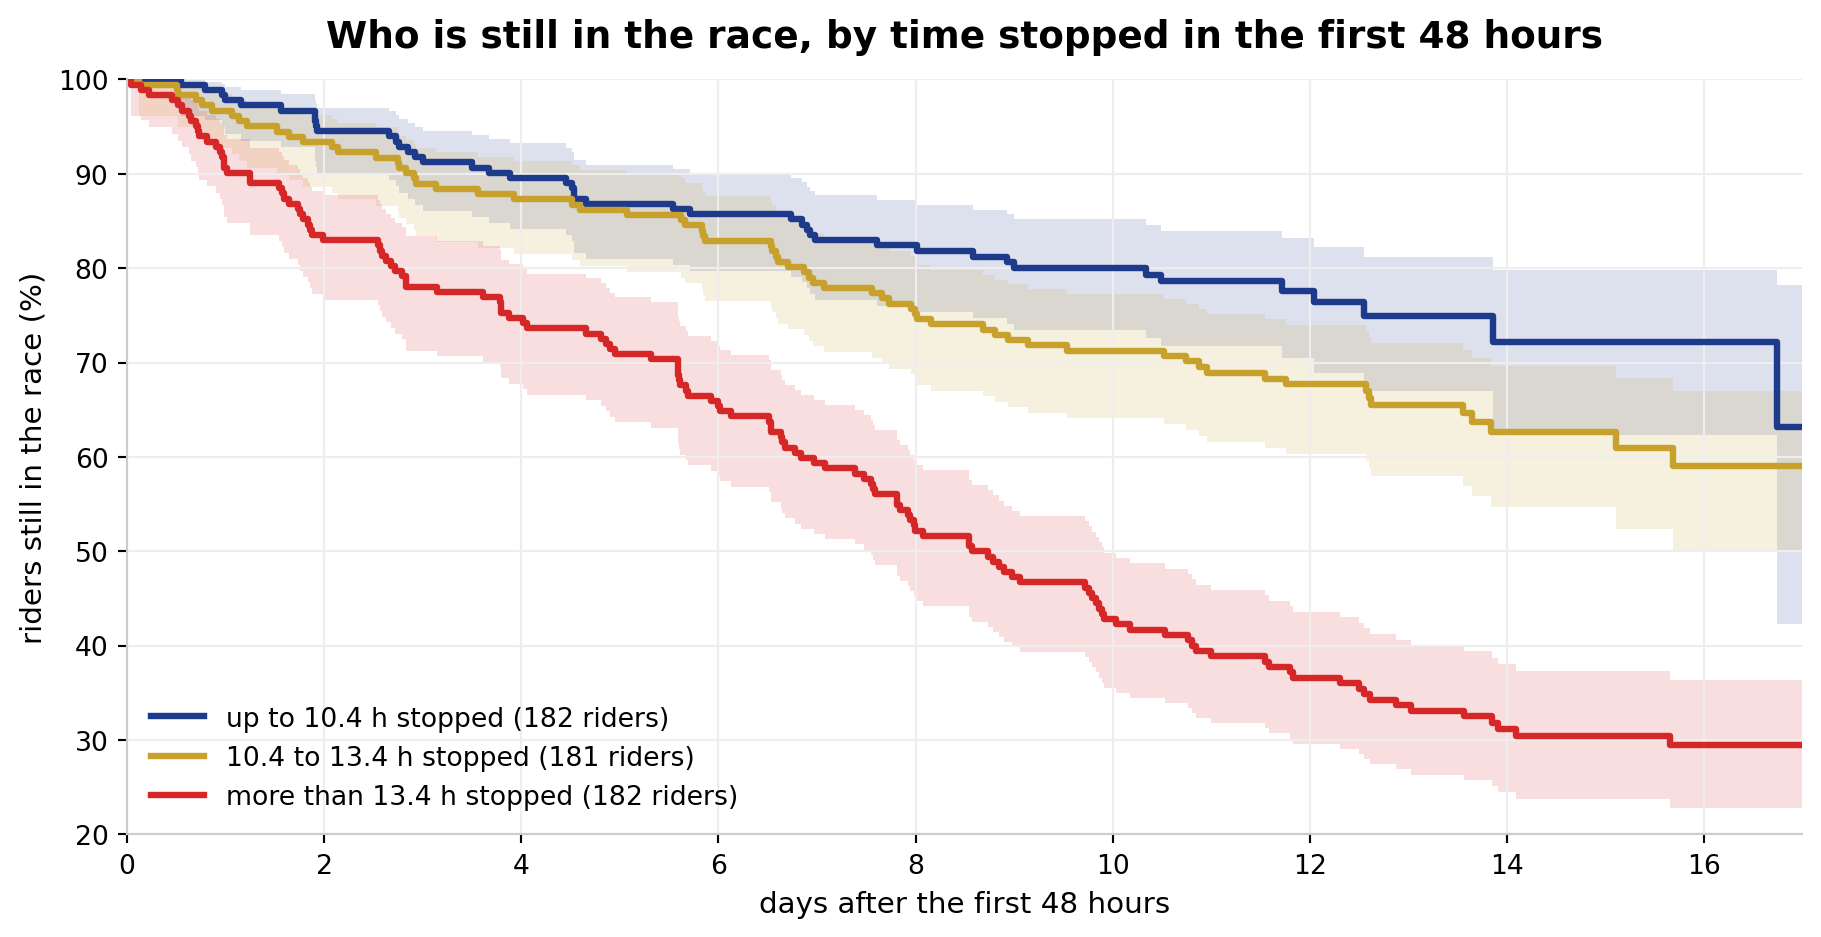
The three curves separate from the first days and keep separating. Of the riders who stopped the least, 24% scratched later. In the middle group it was 38%. Of the riders who stopped the most, 70%.
The Cox model puts a number on it:
| Model | Factor | Hazard ratio | 95% interval | p-value |
|---|---|---|---|---|
| Time stopped | Each hour stopped in the first 48 hours | 1.13 | 1.10 to 1.16 | 3 × 10⁻¹⁸ |
| Being a man | 1.06 | 0.74 to 1.54 | 0.74 | |
| Time stopped and speed | Each hour stopped in the first 48 hours | 1.10 | 1.07 to 1.14 | 4 × 10⁻⁹ |
| Each km/h of moving speed in the first 48 hours | 0.91 | 0.86 to 0.97 | 0.004 | |
| Being a man | 1.24 | 0.85 to 1.82 | 0.27 |
Each extra hour stopped in the first 48 hours raises the later risk of scratching by 13%. Three extra hours make it about 44% higher. When moving speed enters the model, both count on their own: each extra hour stopped raises the risk by 10%, and each extra km/h of moving speed lowers it by 9%. Sex adds nothing in either model.
The long stops carry the effect. With moving speed in the model, each hour in stops of 30 minutes or more raises the risk by 10% (hazard ratio 1.10, 95% interval 1.07 to 1.14), while the time in shorter stops shows no effect (hazard ratio 1.01, p = 0.89). The results are the same when the race is measured in kilometres.
One caution about what this means. The model predicts, and it cannot tell why a rider stopped. A long stop may be a choice, or it may be an injury or a broken bike that ends the race some days later.
In short
- Women and men abandon at the same rate. The survival curves overlap and no test detects a difference, by time or by distance.
- Men ride faster, and both stop the same. Men move about 10% faster, and the time stopped in the first 48 hours is the same for women and men.
- The first 48 hours predict who finishes. Less time stopped and a higher moving speed each lower the later risk of scratching, for women and men alike.
For a rider, the practical reading is to keep the stops short in the first two days and to hold the pace. That is a skill, and it can be trained in shorter ultra-distance events, such as those of Pedalma, Badlands or Transpyrenees, before taking on a race like the TCR.
Two limits. The study covers two editions and 81 women, so the interval for the effect of sex is wide (a hazard ratio between 0.75 and 1.50) and a moderate difference cannot be ruled out. And the positions come from public trackers that report every few minutes, so the speeds and the stops are estimates.
More about this line of work on the project page.
Reference
Garamendi, J. F. (2026). Do Women and Men Fail Differently? DNF Risk Prediction in Self-Routed Ultracycling (TCRNo10-No11). Science & Cycling Conference 2026, Barcelona, 1 and 2 July 2026.
No GitHub account? Write to me at .