velodata.ai velodata.ai The Mathematical Beauty of Cycling
  • Blog
  • Projects
  • Apps
  • About
  • Work with me

Data science, applied maths and modelling for professional cycling.

velodata answers the questions of cycling teams, brands, race organisers and sports-tech companies with data: how hard a stage is for each rider, whether a product claim holds, why riders abandon a race.

See the services Read the blog

What velodata does

01

Race and course analysis

Stage and course difficulty, heat and weather along the route, and who abandons a race, when and why.

02

Equipment testing

Statistical comparison of bikes, wheels and tyres, and review of product claims: what a test can really prove.

03

Prediction and rider selection

Expected results stage by stage, and support for deciding who to line up.

04

Modelling and machine learning

Made-to-measure projects: mathematical and statistical modelling, prediction, reinforcement learning and computer vision.
Selected work

Heat across five editions of an ultra-distance ride
Finished

Which edition of the Madrid-Barcelona by Pedalma was the hottest, and where on the route does the heat hit? A comparison built from my own GPS files.

DNF risk in self-routed ultracycling
In progress

Do women and men abandon differently in the Transcontinental Race? A survival analysis of 568 solo riders.

A physics-based stage difficulty score
In progress

A stage difficulty score based on physics and specific to each rider, meant to replace gradient-only profile scores.

No matching items

All projects

From the blog

Why RaceFit, the rider selector born at Ben-Gurion University and Israel-Premier Tech, would not help a sports director

research
rider-selection

Why RaceFit, trained on past line-ups, would not help a sports director choose better ones.

Oct 3, 2026
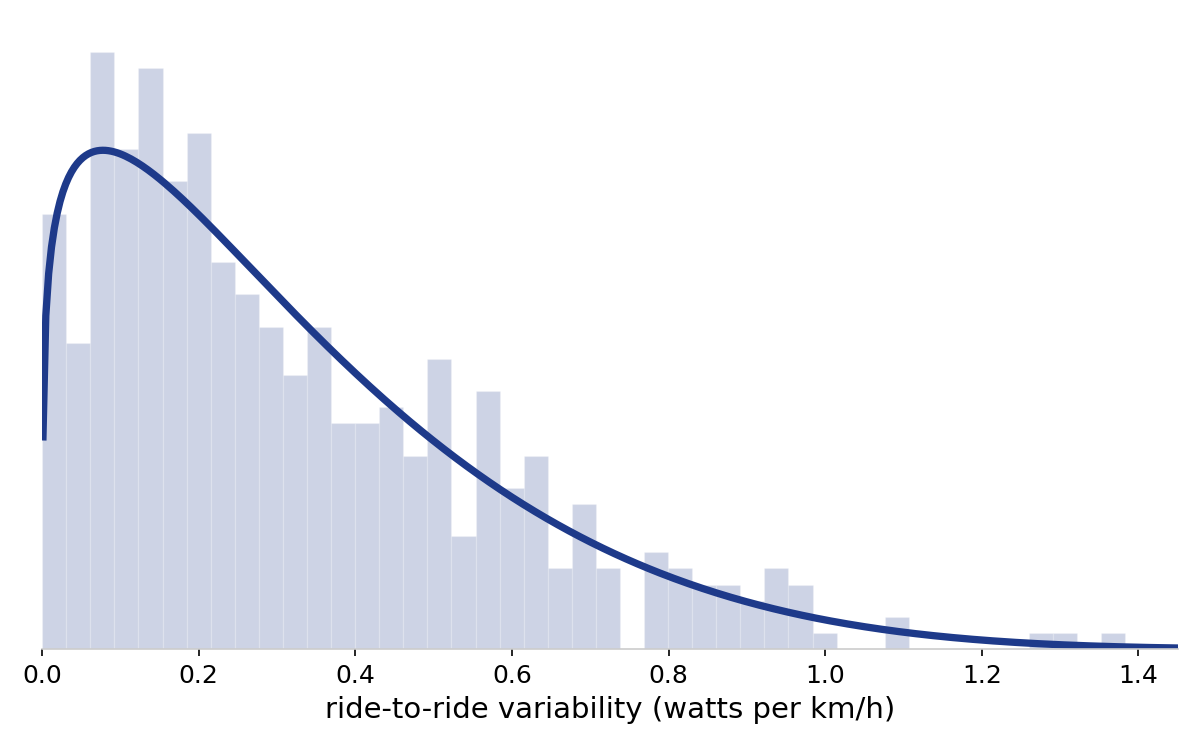
Histogram of the ride-to-ride variability of my own rides, in watts per km/h, with the fitted distribution on top.

Tubeless vs. Tubular: Are SRAM’s Claims Inflated?

equipment

Let’s delve into SRAM’s experiment with the Movistar cycling team. This article explores whether the methodology genuinely demonstrates the superiority of tubeless tires or if there is more to the story.

Oct 1, 2026

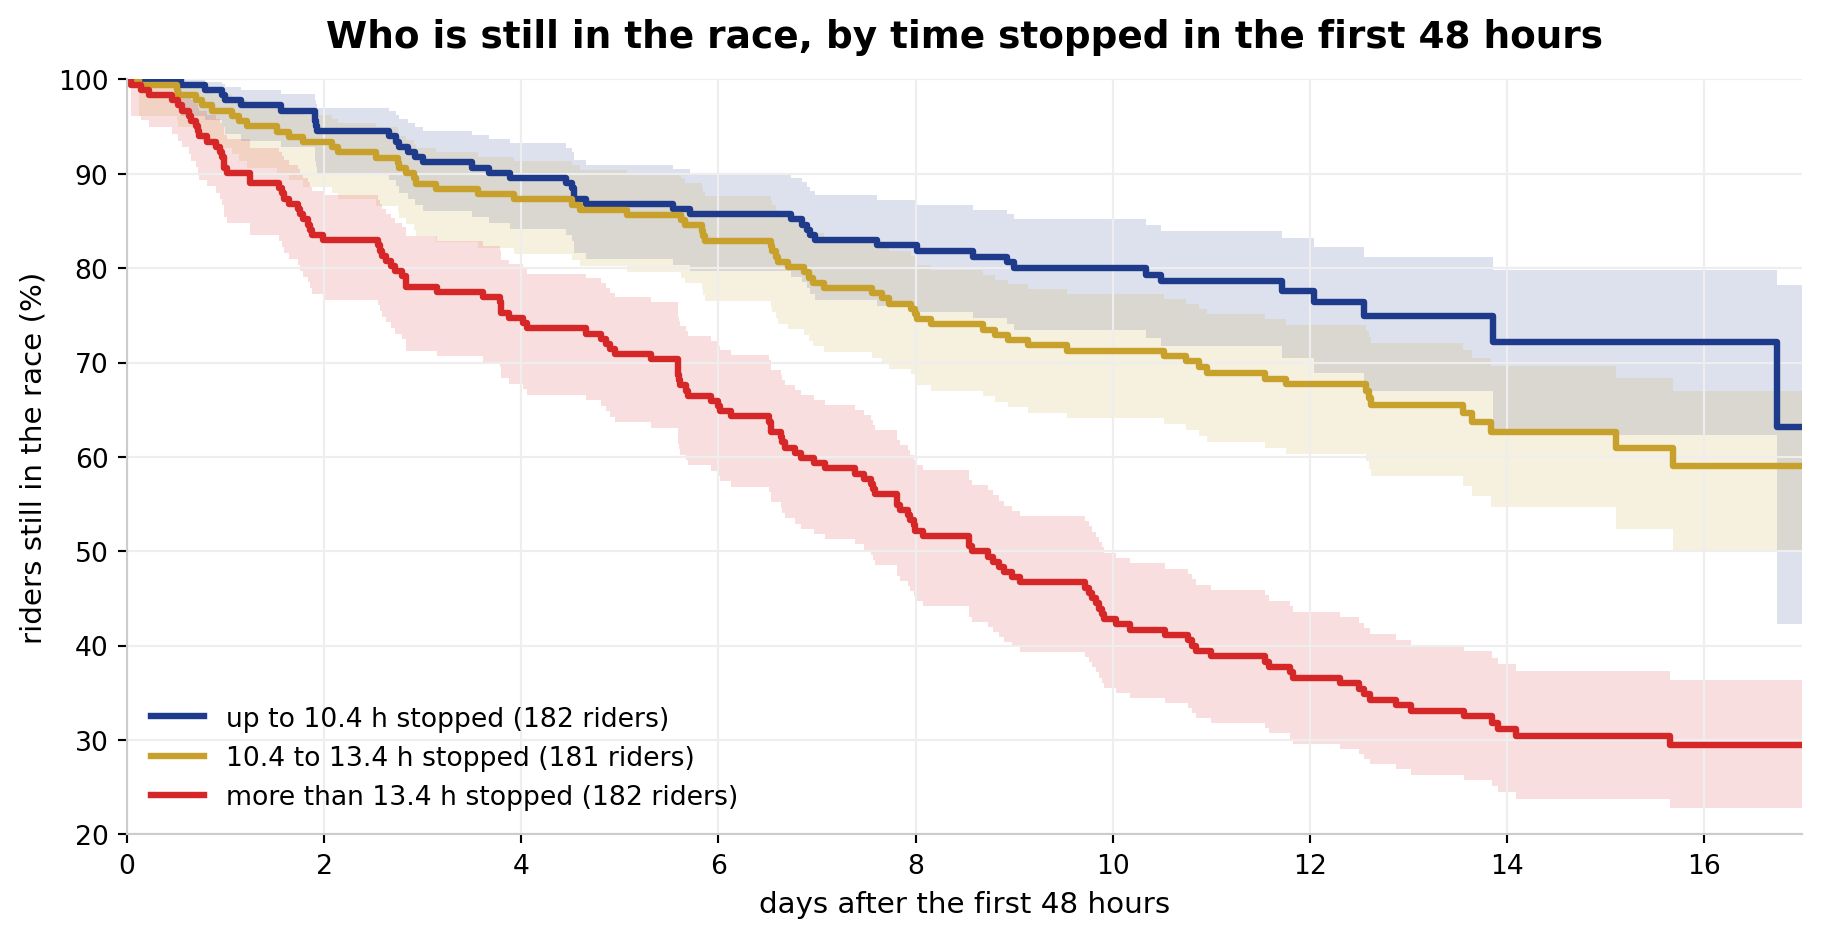
Survival curves after the first 48 hours for three groups of riders, by the time they spent stopped in those 48 hours. After 16 days, about 72% of the group that stopped the least is still in the race, about 59% of the middle group and about 30% of the group that stopped the most.

What predicts a DNF in the Transcontinental Race? The first 48 hours

ultra-dnf
research

A survival analysis of 568 solo riders of the Transcontinental Race No10 and No11: women and men abandon at the same rate, and the time stopped in the first 48 hours predicts who finishes.

Jul 1, 2026
No matching items

All posts

Behind velodata

velodata is the work of Juanfran Garamendi: a PhD in Computer Science & Mathematical Modelling, 15+ years in data science and applied mathematics, 35+ scientific publications and 3 patents. More in About.

A question about your team, your product or your race?

Tell velodata what you need to know.

See how it works